Azure Monitor Agent
Purpose: Send the StorageLink application, audit and license-audit logs to an Azure Monitor Log Analytics Workspace with the Azure Monitor Agent (AMA)
Steps:
- Create a Log Analytics Workspace
- In Cloud Shell (PowerShell), create the custom tables
StorageLinkApplication_CL,StorageLinkAudit_CLandStorageLinkLicenseAudit_CL - Create the Data Collection Endpoint (DCE)
storagelink-ama-endpoint - Stop the VM, then create the application-log and audit-log Data Collection Rules (DCRs) with Custom Text Logs
- Start the VM, then create the license-audit DCR (AMA installs now and picks up all three rules)
Log File Patterns:
- Application:
/opt/swiftgw/log/application-*.log - Audit:
/opt/swiftgw/log/audit-*.log - License audit:
/opt/swiftgw/log/license-audit-*.log(StorageLink 1.3.0 and later)
Important: Keep the VM stopped until only the last DCR is left. This works around an AMA bug: the agent collects only the DCRs that exist when it installs
Already collecting two logs? Create the StorageLinkLicenseAudit_CL table and add the license-audit log to your existing audit DCR as a second data source
Verify: Query each table under the workspace's Logs
Product: StorageLink by Thorn Technologies — cloud storage gateway for secure file sharing
Overview
This article shows you how to install the newer Azure Monitor Agent (AMA) for sending custom logs to your Azure Monitor Log Analytics Workspace (LAW).
The high level steps are as follows:
- Create a Log Analytics Workspace
- create Custom Log tables in your Log Analytics Workspace
- Create a Data Collection Endpoint (DCE), a dependency you'll need later
- Create a Data Collection Rule (DCR) for each log. This will automatically create a couple of dependencies for you:
- Installs the Azure Monitor Agent (AMA) on the VM
- Enables the System Managed Identity on the VM
There are a lot of elements that need to wire together properly in order for this to work. And certain elements need to be created in a specific order.
Create a Log Analytics Workspace
Azure Monitor is a service for aggregating logs and metrics. This information is organized into Log Analytics Workspaces.
In the Azure Portal, go to the Log Analytics Workspace service
Click Create
Choose your Subscription
Create a new Resource Group
Give the Log Analytics Workspace a Name
Choose your Region. Keeping all your resources in the same Region will make troubleshooting easier.
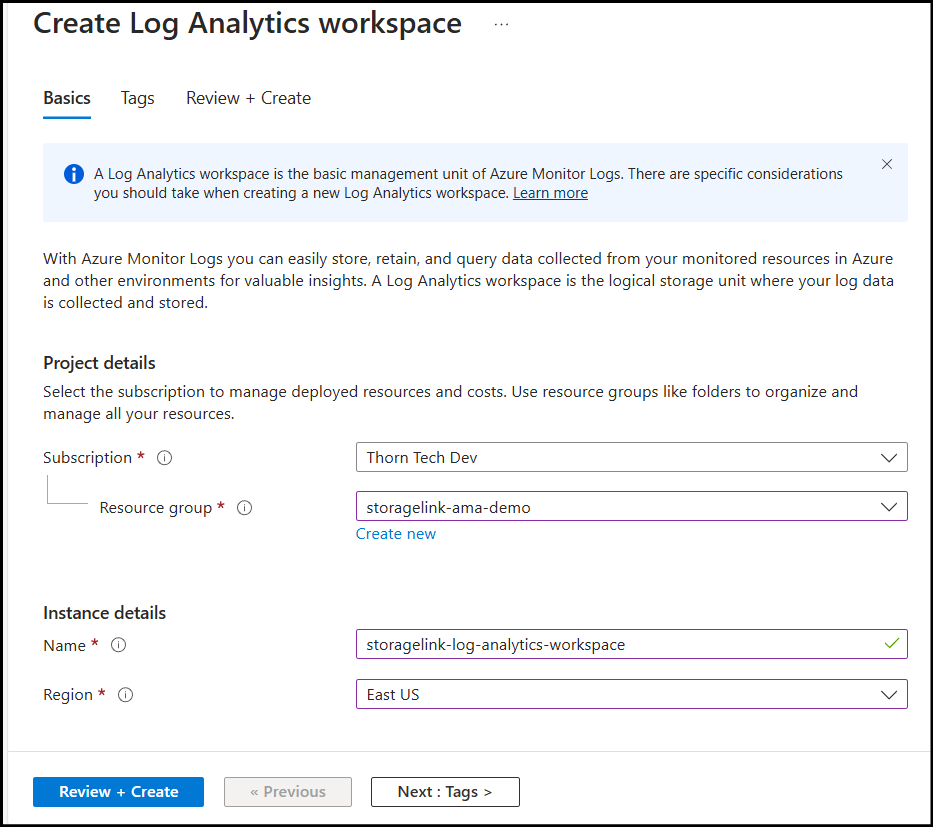
Click Review + Create
Create a Custom Log Table
The StorageLink logs do not match a standard schema. So, you will need to create a new Table in the Log Analytics Workspace to store them.
StorageLink writes three logs:
- Application Log: Events for troubleshooting the Java application
- Audit Log: Web User actions and authentication attempts
- License Audit Log: License events such as activation, replacement, expiry, cluster binding and user-cap import skips (StorageLink 1.3.0 and later)
In this section, you create one table for each log.
In the Azure Portal, you should see the Cloud Shell icon at the top of your screen, to the right of the search bar. Click this to open up the command line console.
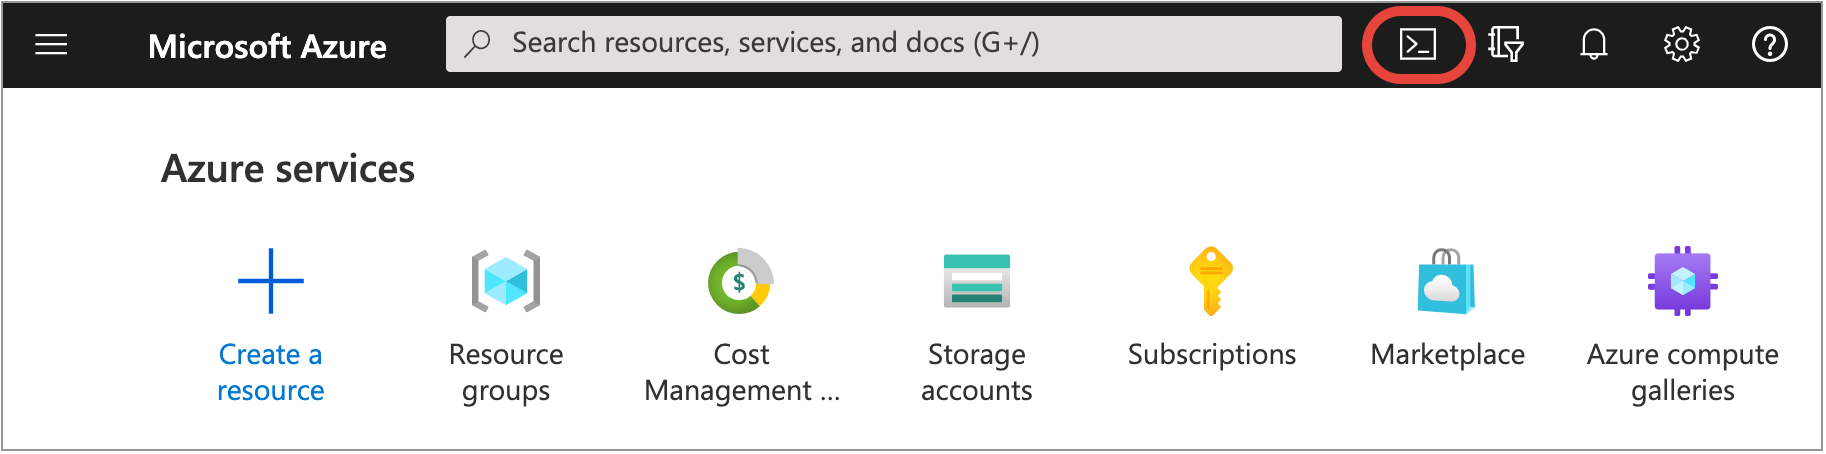
You want to be in the Azure PowerShell environment.
Here, we can run a powershell command to create the Application log table. However, in order to run this command, you will need to know your Subscription id, Resource group name and the Log Analytics Workspace name. If you go to the Properties section on your Log Analytics Workspace, you'll see that information under the Resource ID.

Once you've found the required info, copy the command and replace all the substitute values with <> in their names using the actual subscription & resource values:
$tableParams = @'
{
    "properties": {
        "schema": {
               "name": "StorageLinkApplication_CL",
               "columns": [
                    {
                        "name": "TimeGenerated",
                        "type": "DateTime"
                    },
                    {
                        "name": "RawData",
                        "type": "String"
                    },
                    {
                        "name": "FilePath",
                        "type": "String"
                    },
                    {
                        "name": "Computer",
                        "type": "String"
                    }
              ]
        }
    }
}
'@

Invoke-AzRestMethod -Path "/subscriptions/<subscription-id>/resourceGroups/<resource-group-name>/providers/Microsoft.OperationalInsights/workspaces/<log-analytics-workspace-name>/tables/StorageLinkApplication_CL?api-version=2021-12-01-preview" -Method PUT -payload $tableParams
Then, repeat the process for creating the Audit log table:
$tableParams = @'
{
    "properties": {
        "schema": {
               "name": "StorageLinkAudit_CL",
               "columns": [
                    {
                        "name": "TimeGenerated",
                        "type": "DateTime"
                    },
                    {
                        "name": "RawData",
                        "type": "String"
                    },
                    {
                        "name": "FilePath",
                        "type": "String"
                    },
                    {
                        "name": "Computer",
                        "type": "String"
                    }
              ]
        }
    }
}
'@

Invoke-AzRestMethod -Path "/subscriptions/<subscription-id>/resourceGroups/<resource-group-name>/providers/Microsoft.OperationalInsights/workspaces/<log-analytics-workspace-name>/tables/StorageLinkAudit_CL?api-version=2021-12-01-preview" -Method PUT -payload $tableParams
Finally, create the License Audit log table:
$tableParams = @'
{
    "properties": {
        "schema": {
               "name": "StorageLinkLicenseAudit_CL",
               "columns": [
                    {
                        "name": "TimeGenerated",
                        "type": "DateTime"
                    },
                    {
                        "name": "RawData",
                        "type": "String"
                    },
                    {
                        "name": "FilePath",
                        "type": "String"
                    },
                    {
                        "name": "Computer",
                        "type": "String"
                    }
              ]
        }
    }
}
'@

Invoke-AzRestMethod -Path "/subscriptions/<subscription-id>/resourceGroups/<resource-group-name>/providers/Microsoft.OperationalInsights/workspaces/<log-analytics-workspace-name>/tables/StorageLinkLicenseAudit_CL?api-version=2021-12-01-preview" -Method PUT -payload $tableParams
After successfully running the commands, you should see the custom tables appear on the LAW:

Once all three custom tables have been created, you can create the DCE.
Create a Data Collection Endpoint (DCE)
A Data Collection Endpoint is a dependency that you will need to support Custom Text Logs. Without it, you are limited to collecting Linux Syslogs.
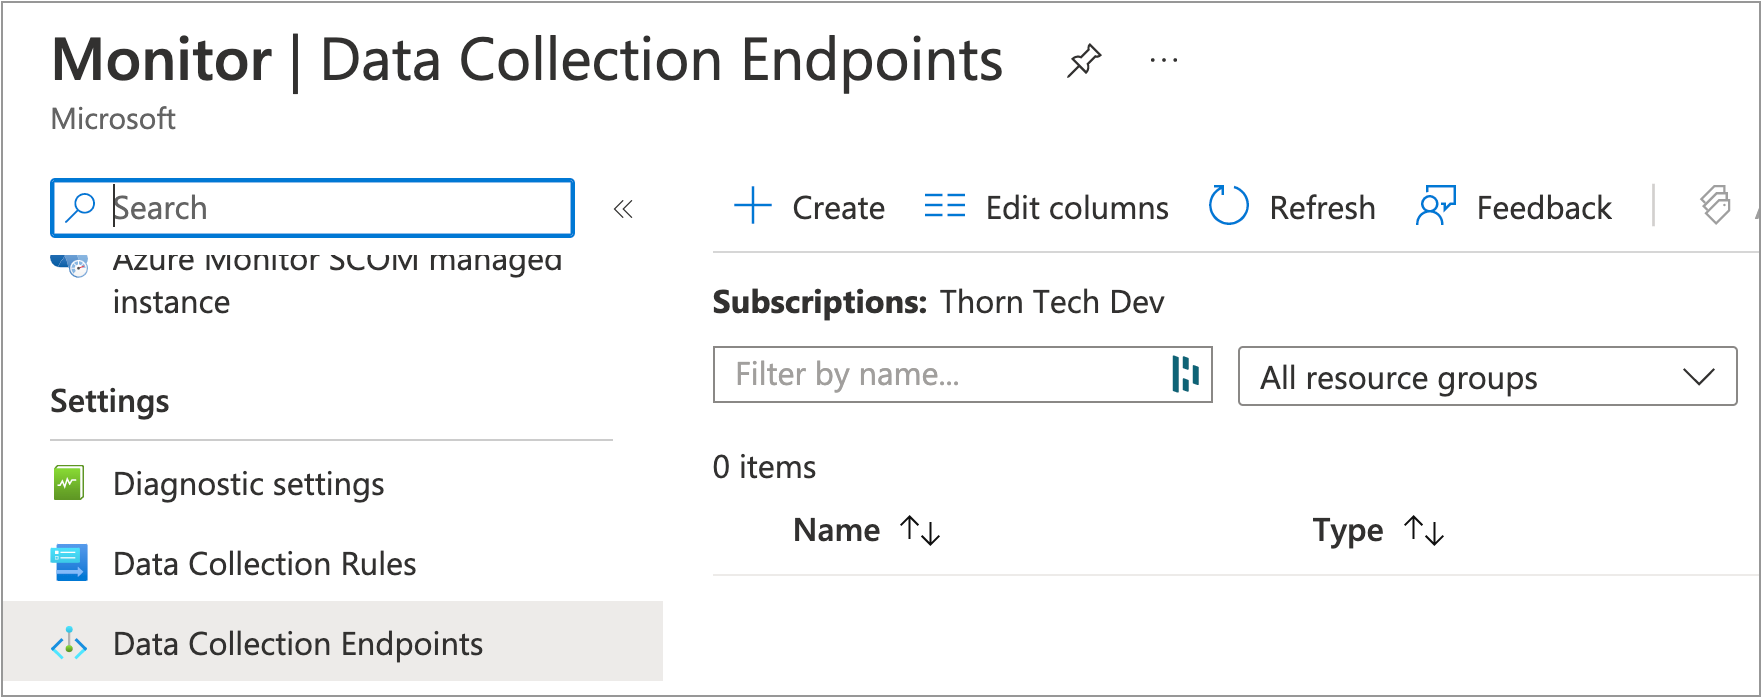
In the Azure Portal, go to the Azure Monitor service
Under Settings, click Data Collection Endpoints
Click + Create
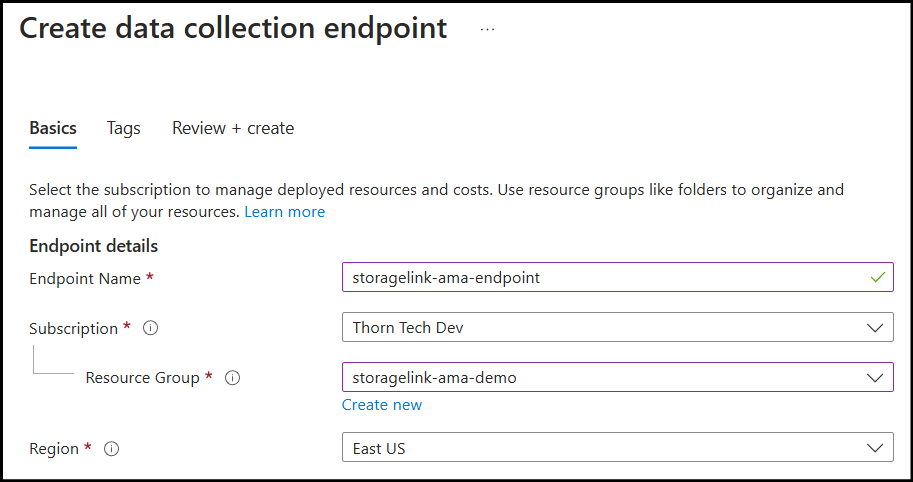
For Endpoint Name, use
storagelink-ama-endpointFor the Resource Group, use the same one as your VM
Region Use the same one as your VM
Click Review + create
Click Create
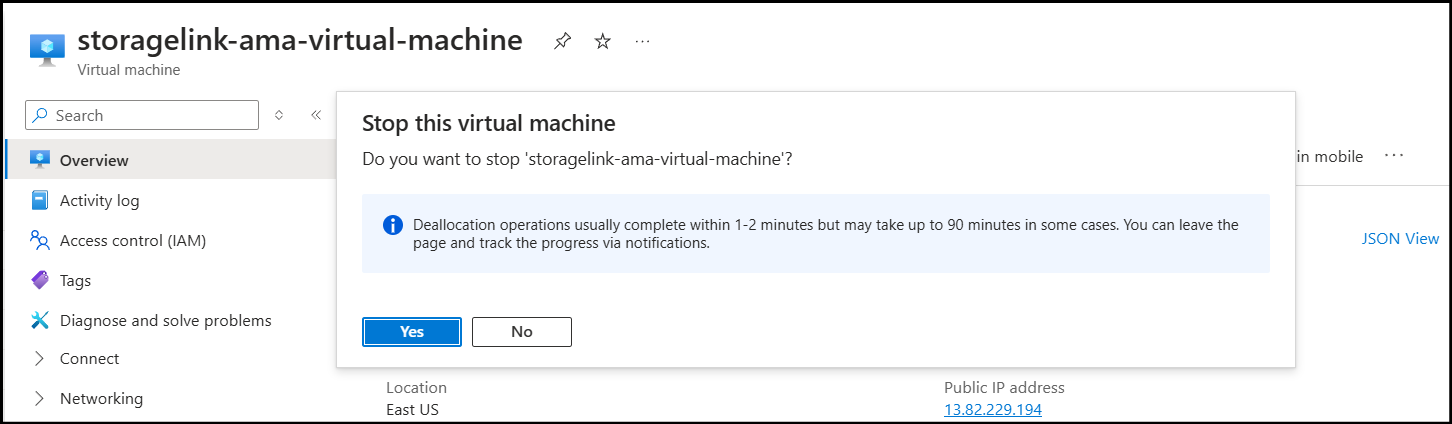
Stop your StorageLink VM (IMPORTANT)
Due to a bug in the current version of the Azure Monitor Agent, we need to do a little bit of a workaround to get all three logs aggregated into the Log Analytics Workspace.
Essentially, you want to STOP your virtual machine before the creation of the first Data Collection Rule (DCR), and keep it stopped while you create the second. Then, start the VM and create the third DCR:
The reasoning behind this is that when you create a DCR while the VM is running, the AMA agent is immediately installed. The agent then streams only the logs in the DCRs that exist at that moment, and ignores any DCR created after it.
If the VM is stopped while you create the first two DCRs, the extension won't be installed since you can't install extensions on a stopped VM. Then, when you turn the VM back on and create the third DCR, the AMA extension is installed and sees all three DCRs.
So, make sure to stop your VM before creating the first DCR.
Create a Data Collection Rule (DCR)
The Data Collection Rule (DCR) kind of does everything. It wires the VM to the Log Analytics Workspace, and defines what kind of logs are collected.
The DCR also creates a couple of dependencies for you automatically:
- Installs the Azure Monitor Agent (AMA) on the VM
- Enables the System Managed Identity on the VM
To create a DCR:
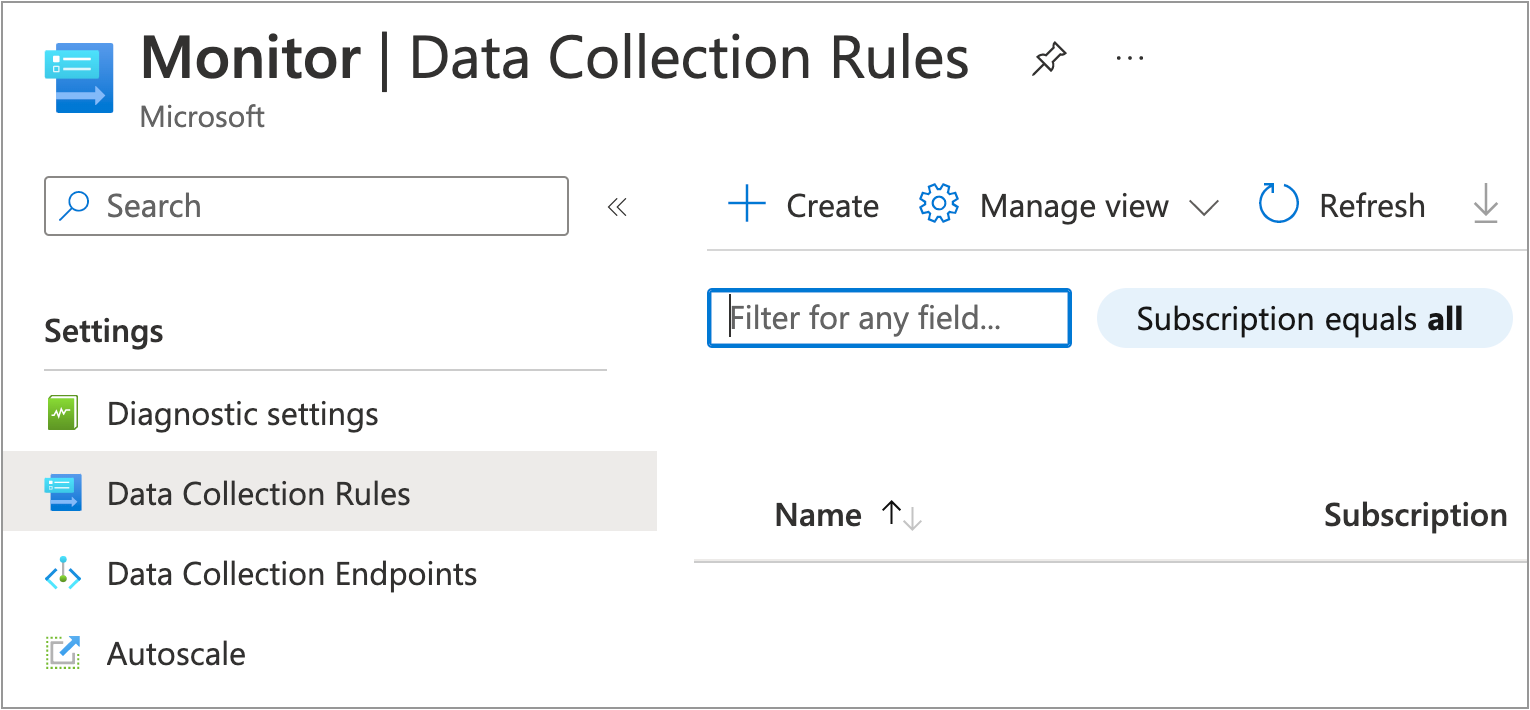
In the Azure Portal, go to the Azure Monitor service
Under Settings, click Data Collection Rules
Click + Create
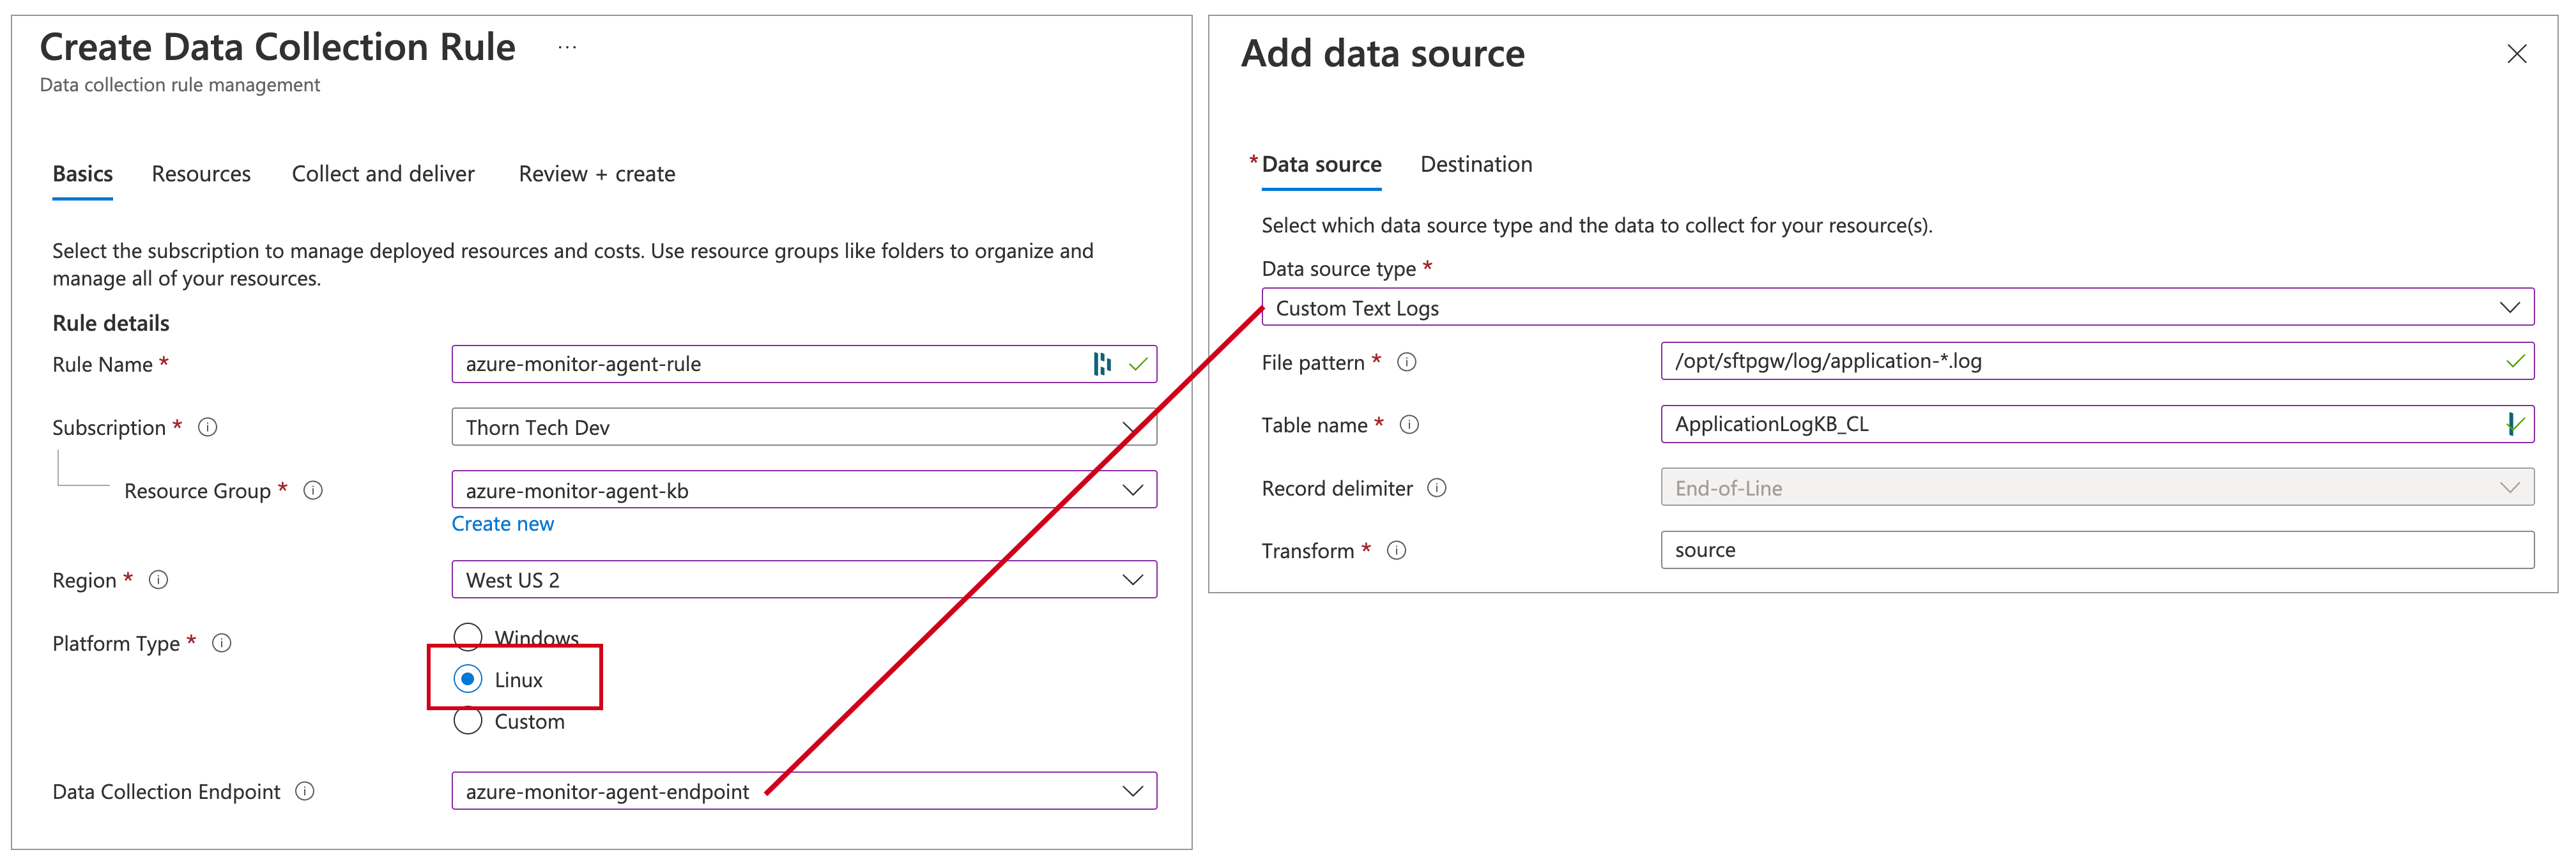
On the Basics tab, configure the following:
Rule Name: Use
storagelink-application-dcrResource Group: Use the same one as your Log Analytics Workspace
Region: Important: make sure this matches your VM's region
Platform Type: Use
LinuxData collection endpoint: Set it to
storagelink-ama-endpoint, which you just created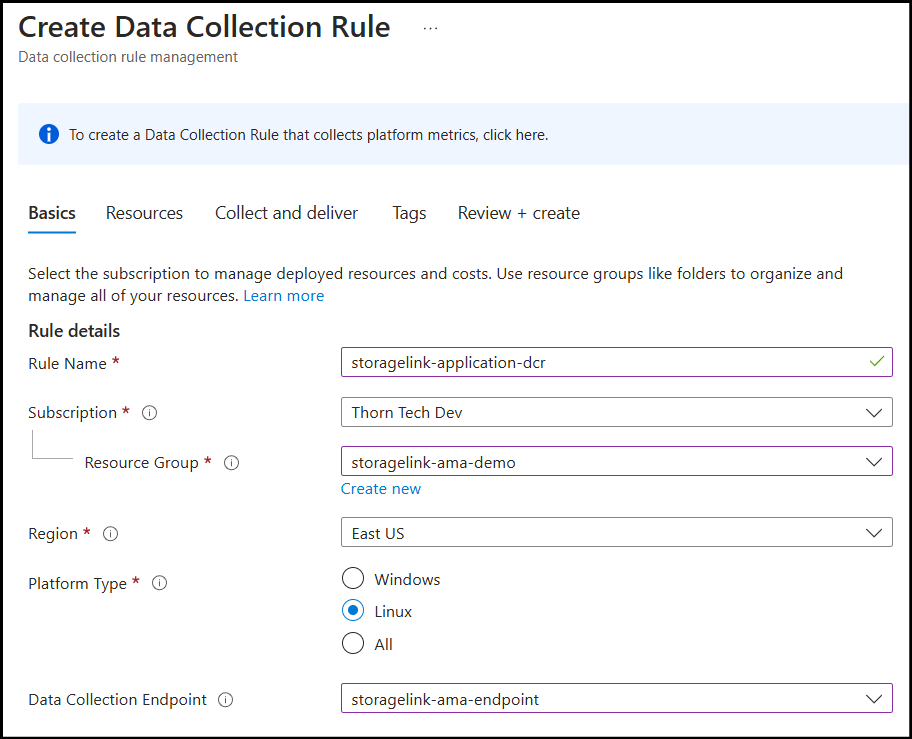
Click Next: Resources
On the Resources tab, do the following:
Click + Add resources
Check the box next to your VM, and click Apply
Click the checkbox for Enable Data Collection Endpoints
In the table column for Data collection endpoint, choose
storagelink-ama-endpointin the drop-down menu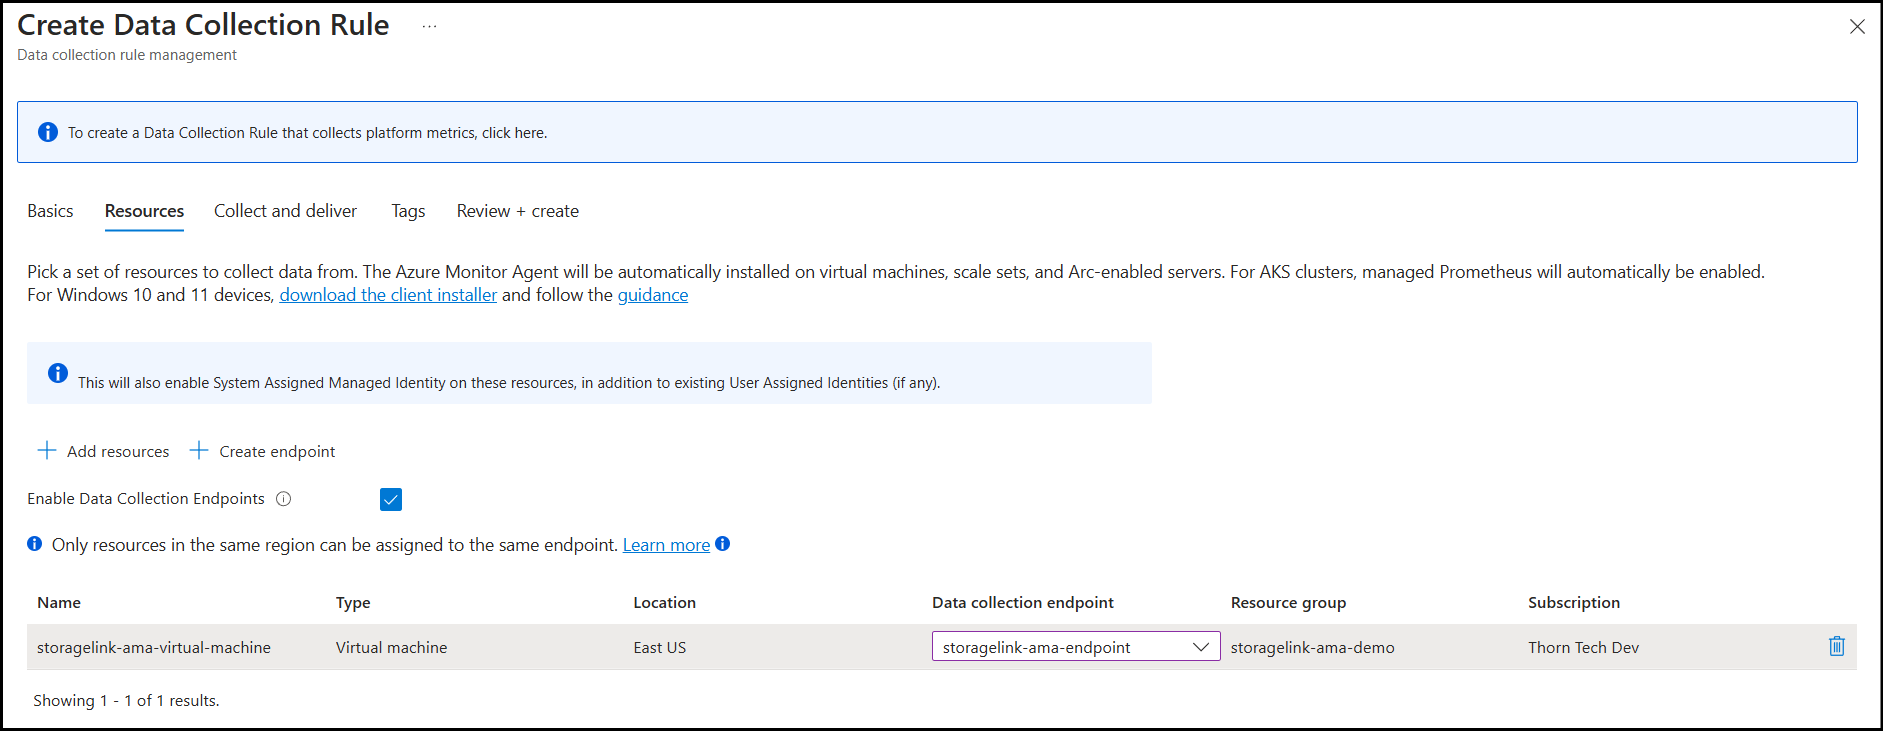
Click Next: Collect and deliver
On the Collect and deliver tab, do the following:
- Click + Add data source
- For Data source type, choose Custom Text Logs from the drop-down menu. Note: you need to set the DCE on the Basics tab for this option to be available
This opens an Add data source modal window.
On the Data source tab, set the following options:
Data source type:
Custom Text LogsFile pattern:
/opt/swiftgw/log/application-*.logTable name:
StorageLinkApplication_CLTimeStamp format:
ISO 8601Transform:
source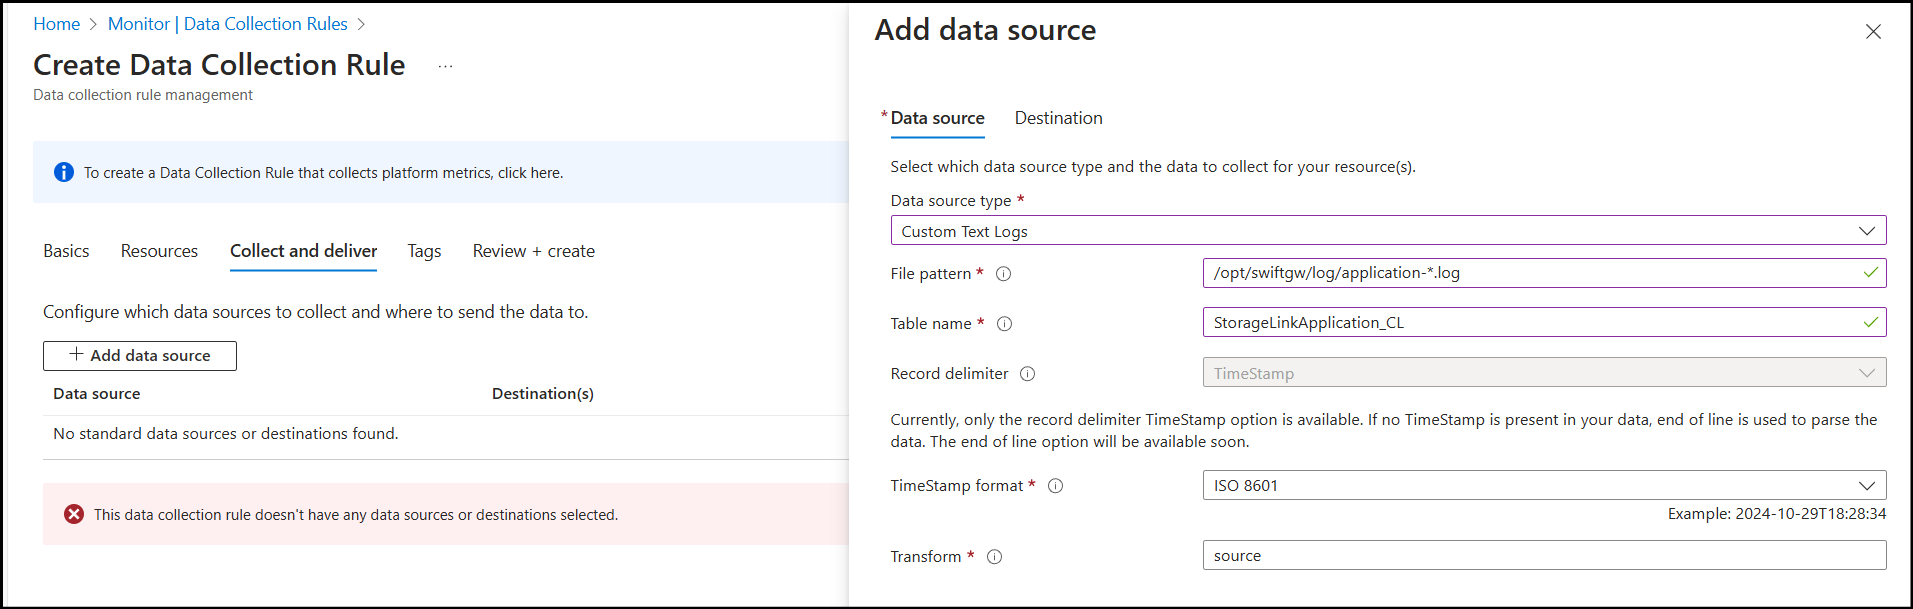
On the Destination tab, select the LAW you created earlier:
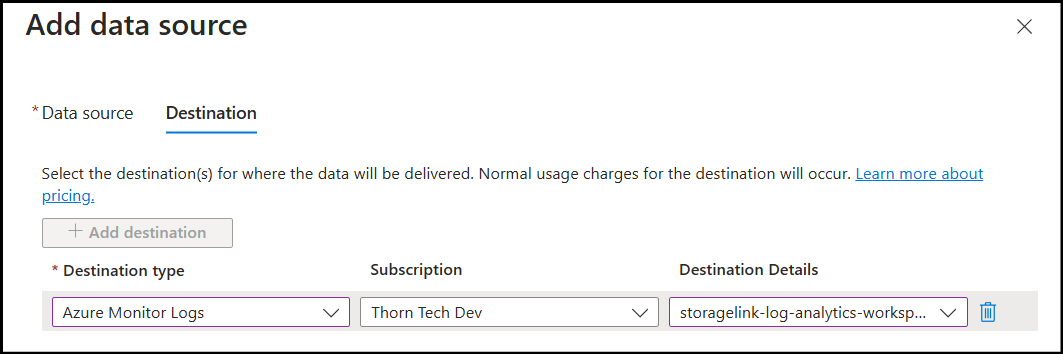
At the bottom of the screen, click Add data source
Click Review + create
Click Create
With the VM still stopped, repeat this process to create a DCR for the StorageLink audit logs:
- Rule Name:
storagelink-audit-dcr - Data source type:
Custom Text Logs- File pattern:
/opt/swiftgw/log/audit-*.log - Table name:
StorageLinkAudit_CL - TimeStamp format:
ISO 8601 - Transform:
source
- File pattern:
Turn your StorageLink VM back on, then repeat this process a third time to create a DCR for the license-audit logs:
- Rule Name:
storagelink-license-audit-dcr - Data source type:
Custom Text Logs- File pattern:
/opt/swiftgw/log/license-audit-*.log - Table name:
StorageLinkLicenseAudit_CL - TimeStamp format:
ISO 8601 - Transform:
source
- File pattern:
Adding the license-audit log to an existing setup
If you already collect the application and audit logs, for example after an in-place upgrade to StorageLink 1.3.0, the Azure Monitor Agent is already installed and would ignore a new DCR. Add the license-audit log to your existing audit DCR instead:
Create the
StorageLinkLicenseAudit_CLtable with the PowerShell command in Create a Custom Log TableIn the Azure Monitor service, under Settings, click Data Collection Rules, and open your audit DCR
Under Configuration, click Data sources, then + Add
Enter the license-audit settings shown above (Custom Text Logs, file pattern
/opt/swiftgw/log/license-audit-*.log, tableStorageLinkLicenseAudit_CL,ISO 8601,source), set the Destination to your Log Analytics Workspace, and click Add data source
Verify the Azure Monitor Agent installation
While you were creating the DCRs, Azure automatically installs the Azure Monitor Agent (AMA) on the VM. To verify this, do the following:
Go to the VM detail page in the Azure Portal
Under Settings, go to Extensions + applications
You should see the
AzureMonitorLinuxAgentwith a status ofProvisioning succeeded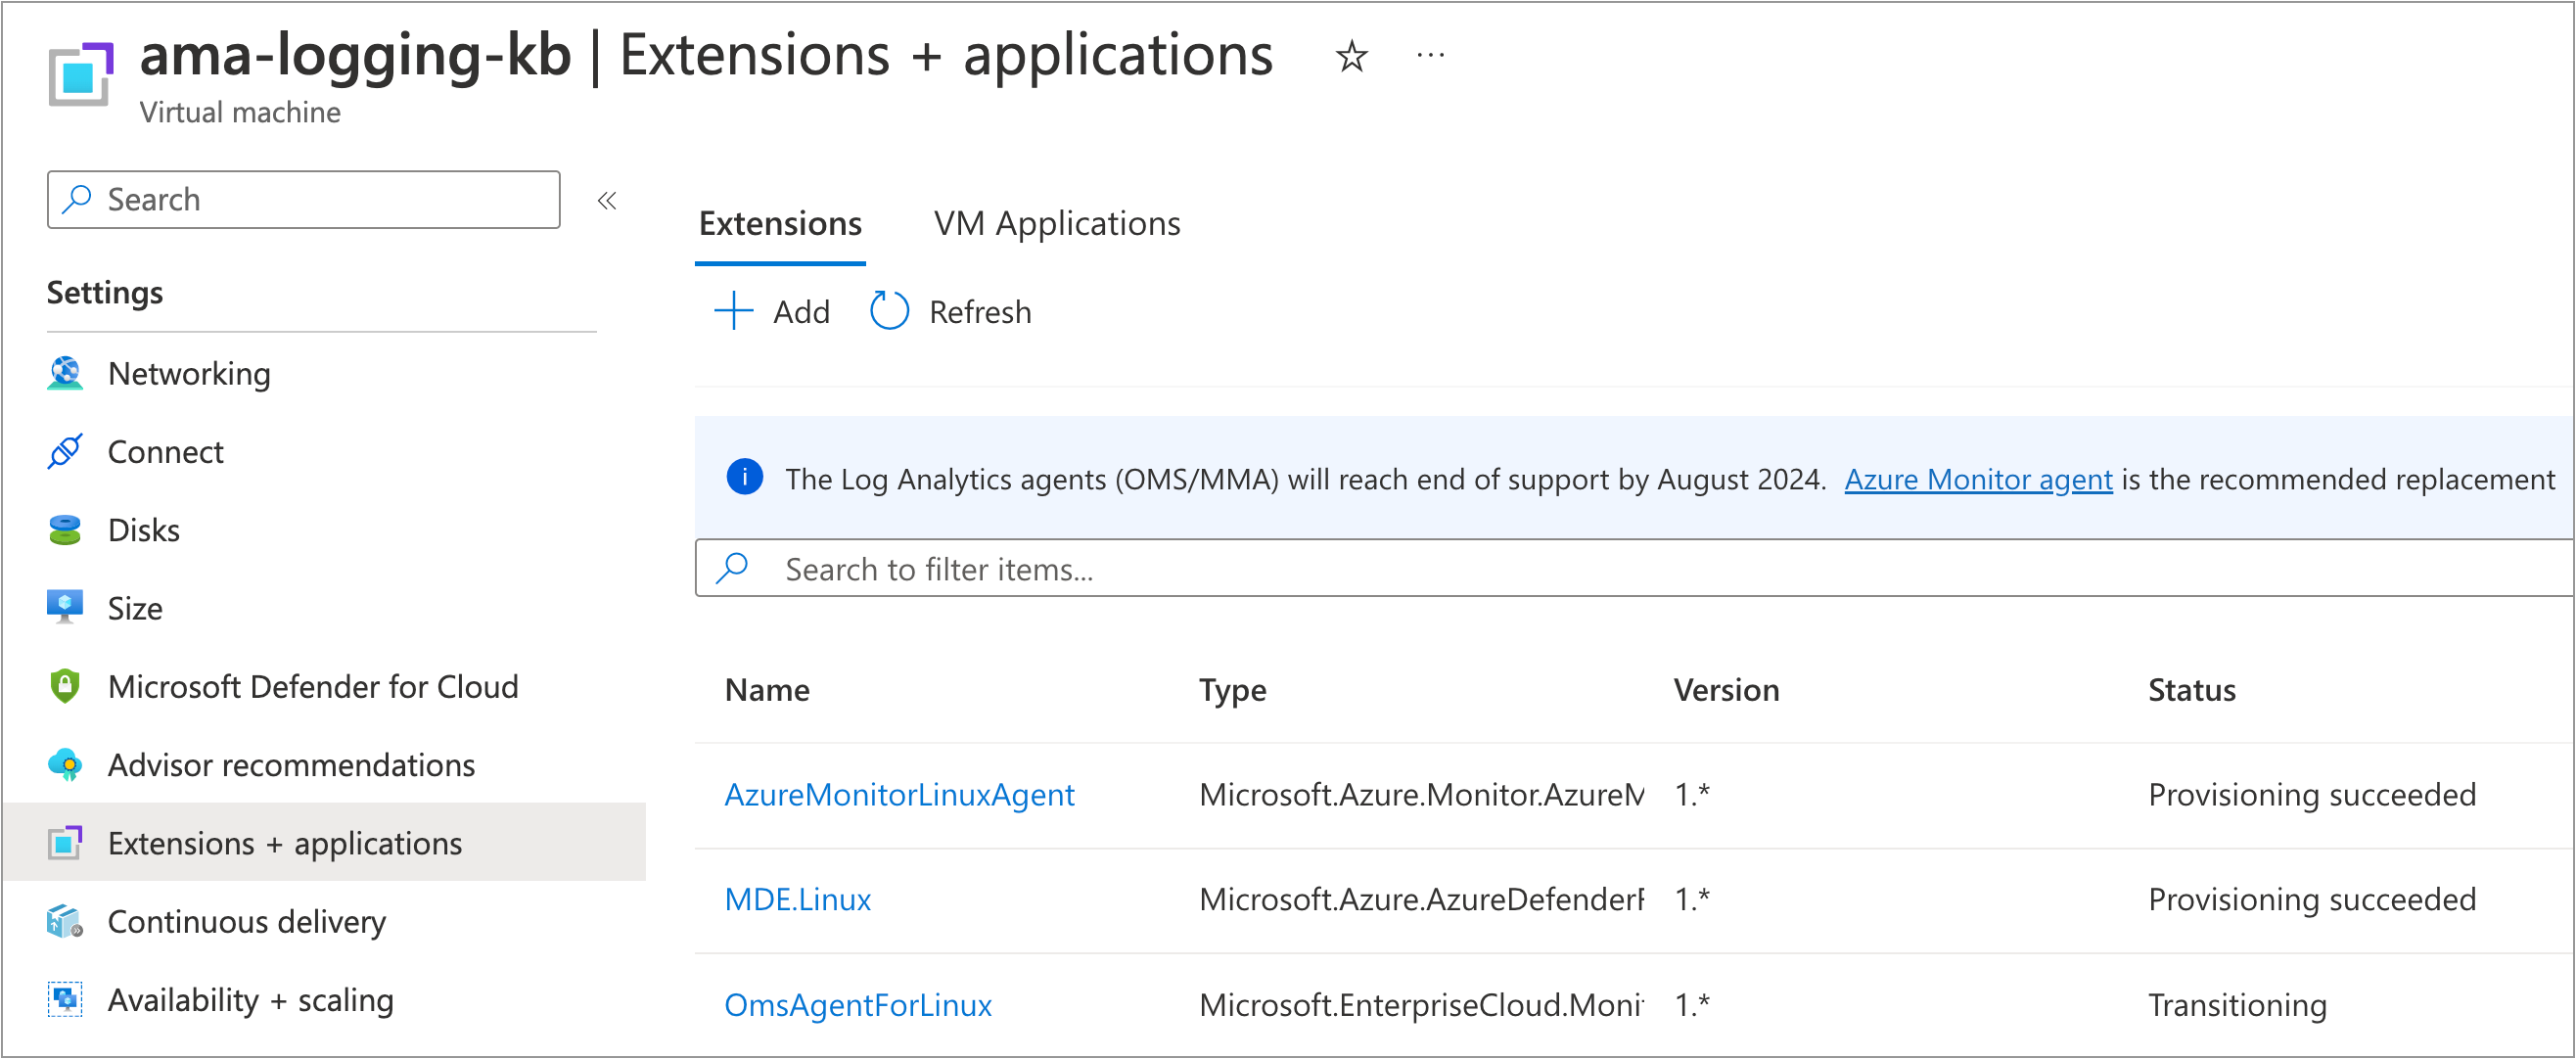
Check for incoming logs
At this point, everything should be wired properly. In this section, you are going to check the Log Analytics Workspace for any incoming logs.
In the Azure Portal, search for Log Analytics workspaces
Select the Log Analytics Workspace you created earlier
In the left menu, under General, click Logs
If you see a Queries modal, click the X on the top right to close it
Type the following query:
StorageLinkApplication_CL
| project RawData
You should see rows of results in table below.
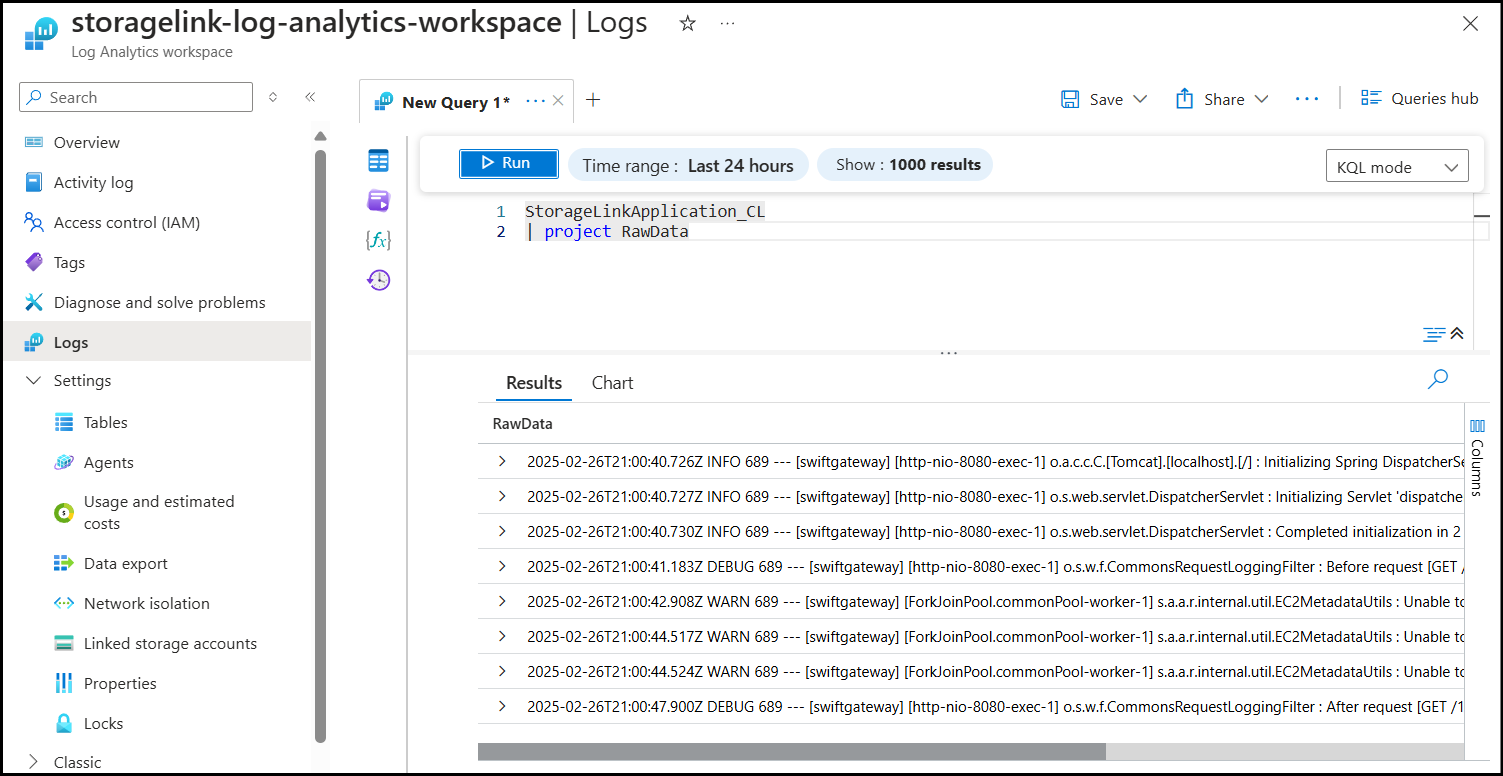
To check the other two logs, run the same query with StorageLinkAudit_CL or StorageLinkLicenseAudit_CL as the table name. StorageLink writes to the license-audit log only when a license event occurs, such as an activation or expiry, so that table can stay empty until then.
Troubleshooting
There are a lot of moving pieces, and there are many things that can go wrong. This section has some troubleshooting steps you can try.
No logs are showing up in the Log Analytics workspace query
- Try waiting an hour to give the incoming logs from the VM a chance to arrive
- Try generating log activity on the VM. For example, restart the Java service:
service swiftgateway restart - Make sure the Time range covers the log entries on the VM (i.e. try selecting Last 7 days)
- Run the query
Heartbeat. This will show the latest heartbeat from the VM.
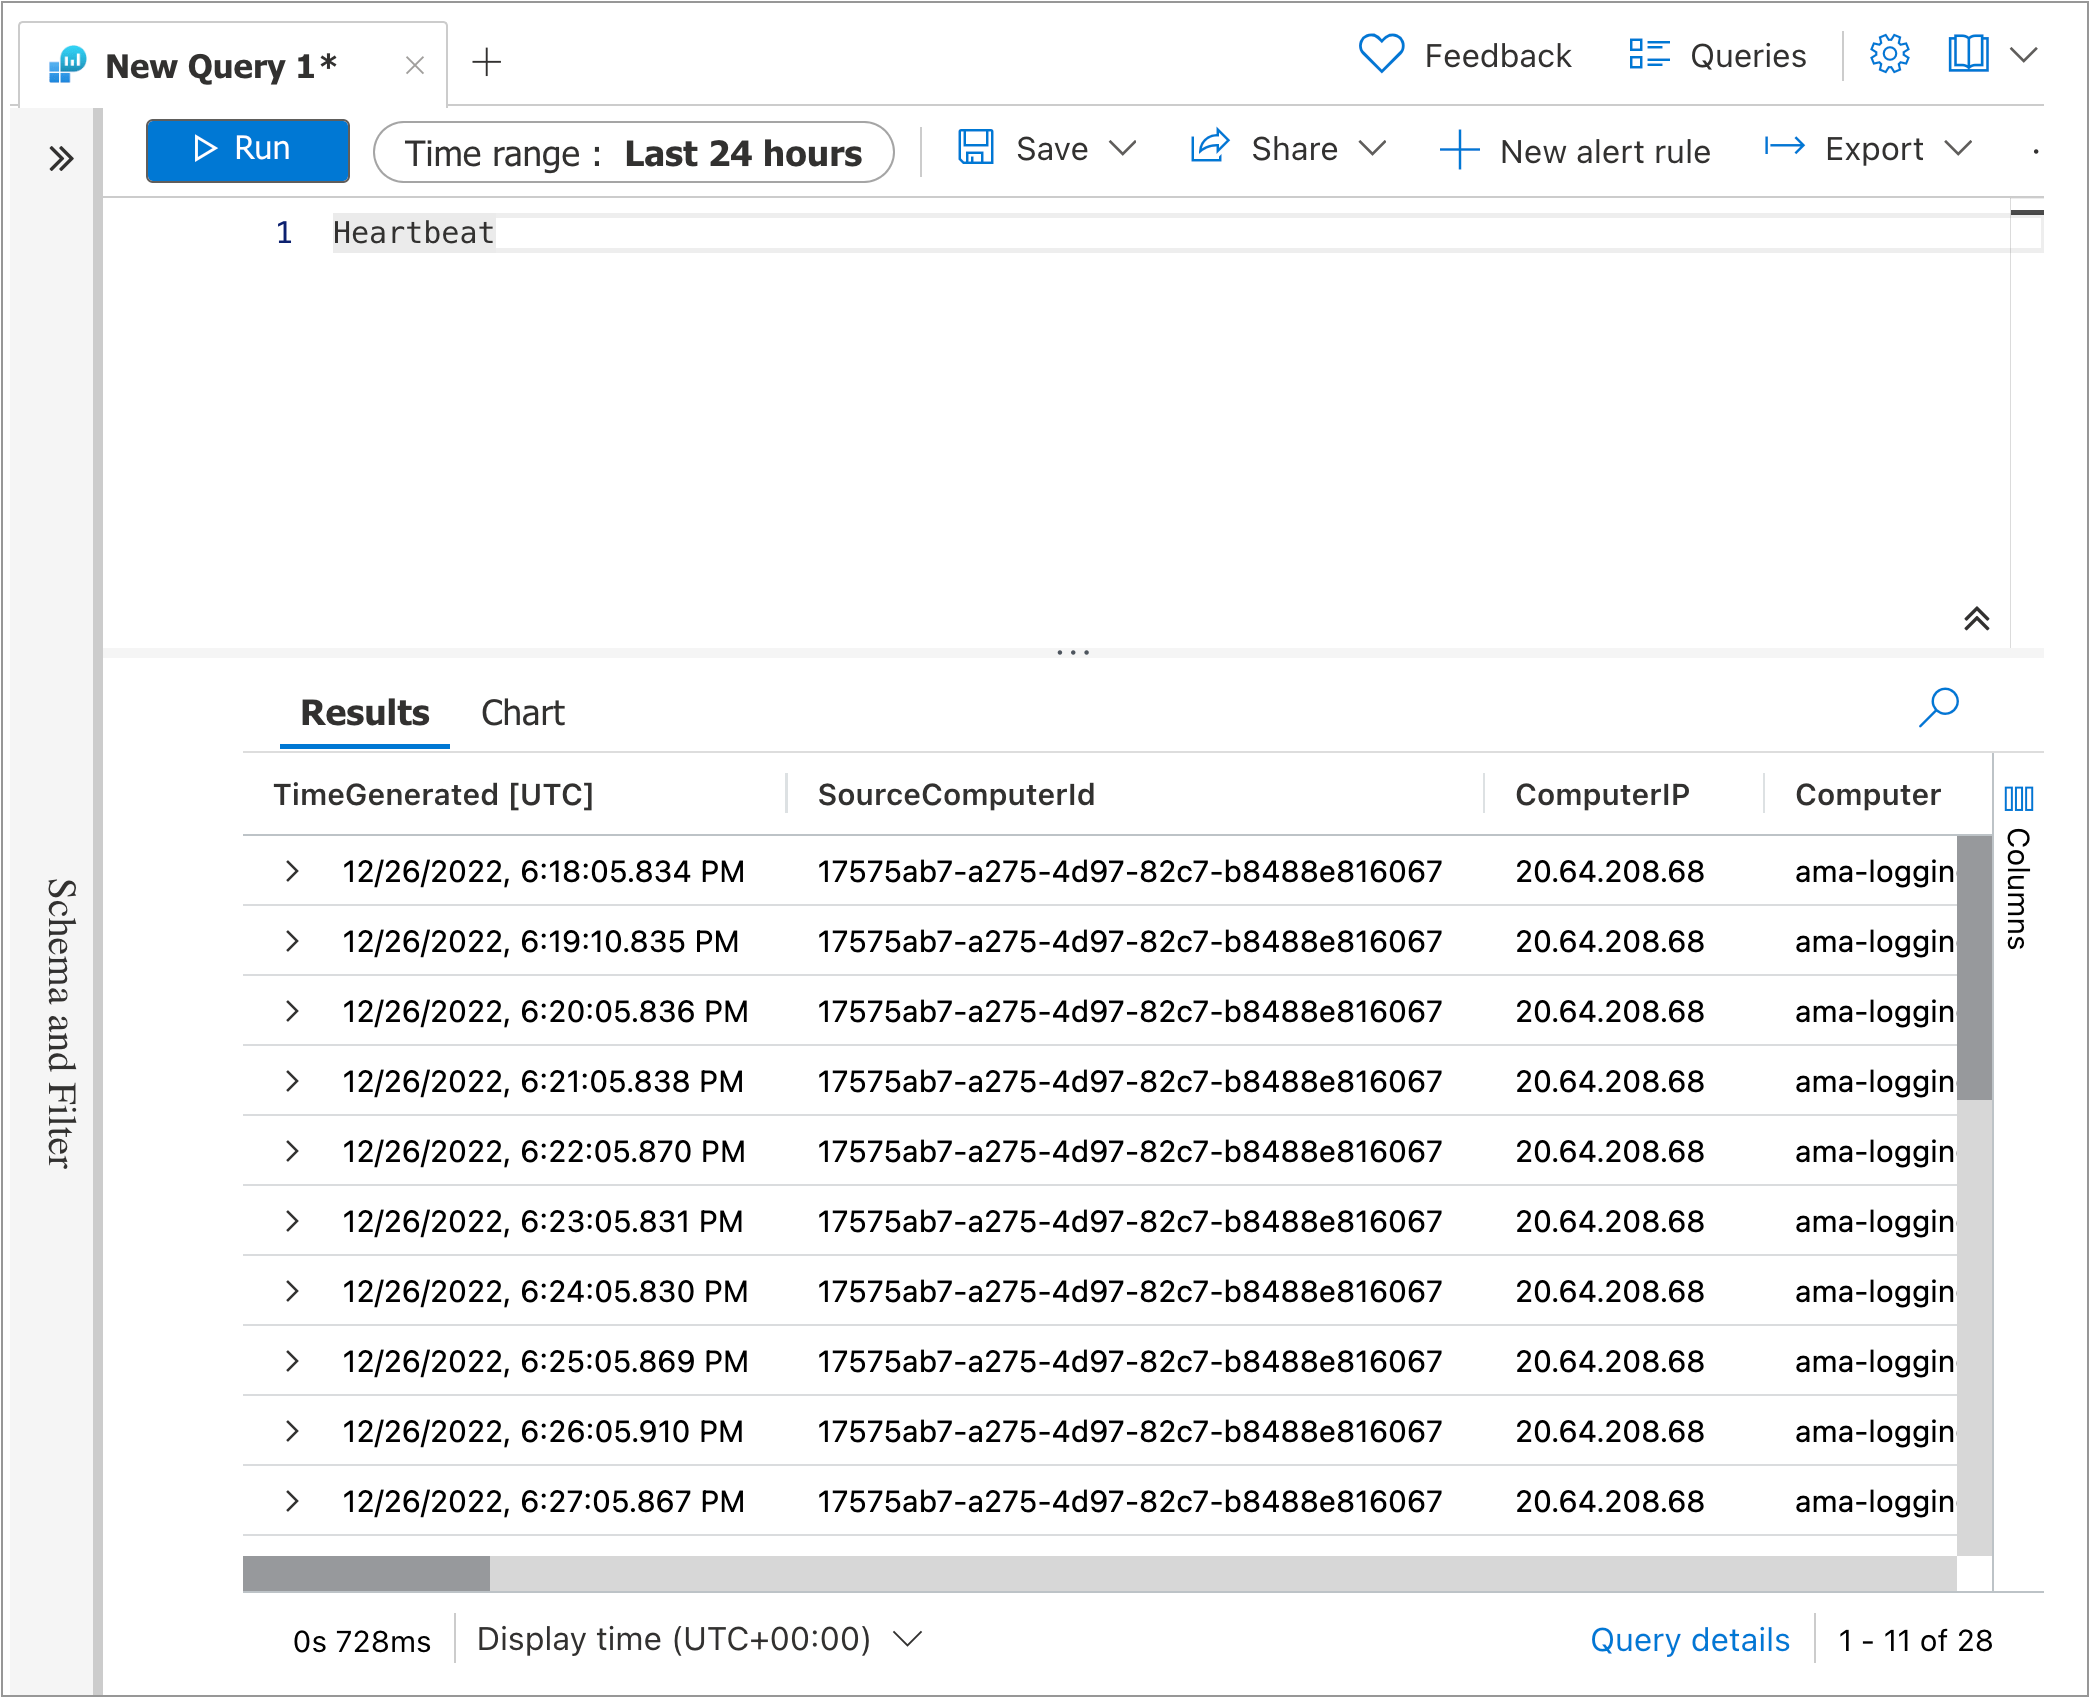
The Azure Monitor Agent extension is not installing
Try manually installing the AMA software:
az vm extension set --name AzureMonitorLinuxAgent --publisher Microsoft.Azure.Monitor --ids /subscriptions/abc-123/resourceGroups/rob-vm/providers/Microsoft.Compute/virtualMachines/rob-vm --enable-auto-upgrade true
You will need to supply the VM's Resource ID for the --ids parameter.
To get the VM's Resource ID:
Go to the VM's detail page
Under Settings, click Properties
Scroll down, and look for Resource ID
The option for Custom Text Logs does not show up on the DCR
The Custom Text Logs option only shows up if you have a DCE set on the Basics tab. Try creating the DCE first.
Note: The Custom radio button (next to Windows and Linux) does not give you custom text logs. Rather, this setting means "both" Windows and Linux.