Diagnostics screen
TLDR - Quick Summary
What: Built-in diagnostics and log viewer in web admin UI (v3.4.1+)
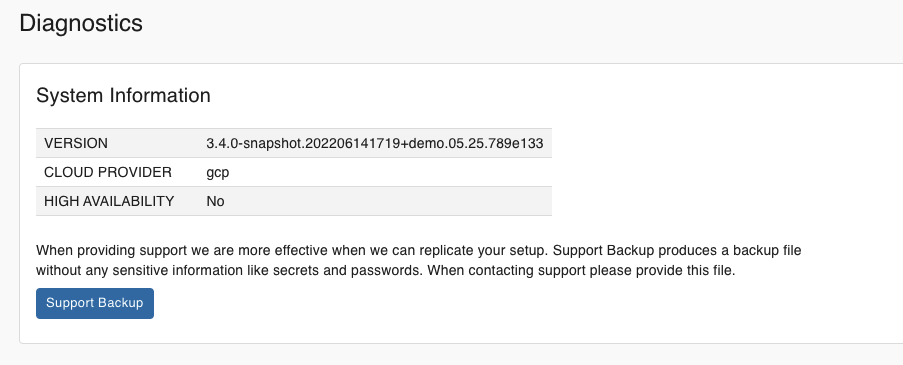
System Info: Shows version, cloud provider, HA status + Support Backup export
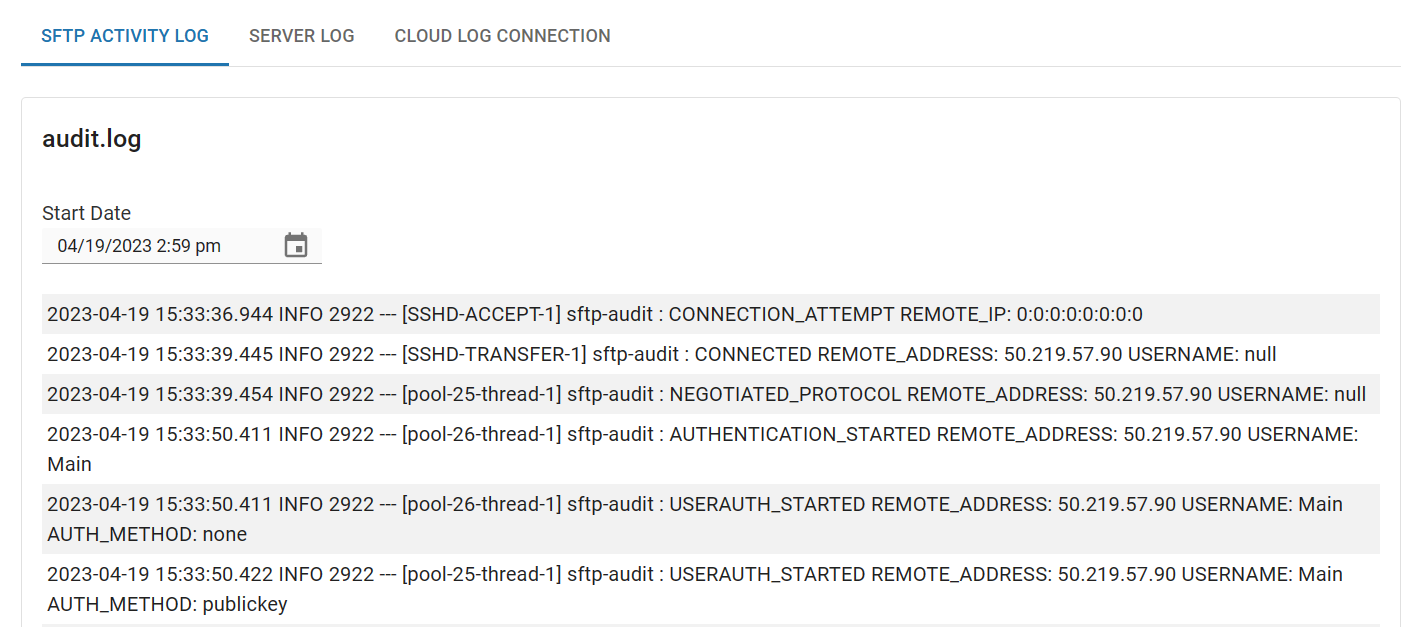
Log Viewer: View SFTP Activity Log and Server Log without SSH access
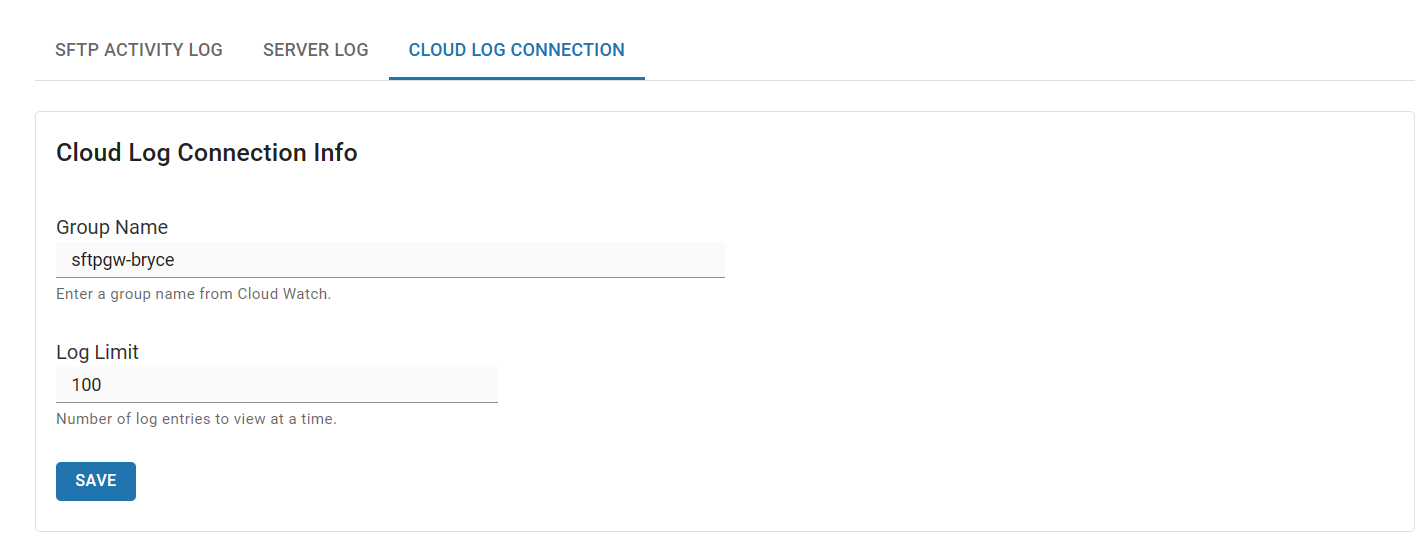
Setup: Configure CloudWatch LogGroup name under Cloud Log Connection tab
Overview
In SFTP Gateway version 3.4.1, we have added a Diagnostics screen. Here, you will find some tools that will help with troubleshooting.
System Information
The System Information screen helps you gather important information that you will need when emailing our support team.

This section provides the following information, which you can include as a screenshot when creating a support request:
- Version: The specific version of SFTP Gateway (e.g.
3.4.1) - Cloud Provider: This will be either AWS, Azure, or GCP
- High Availability: Most setups will use a single instance, but some may use HA
There's also a Support Backup button that will export your users and settings as a yml document. You can send this file to our support team so that we can try to reproduce the issue.
Note: This Support Backup file will redact sensitive information such as credentials. So, do not use this for backup and recovery purposes.
Setting Up
In order to view the logs, under the Cloud Log Connection tab, you will need to specify your LogGroup name from CloudWatch.

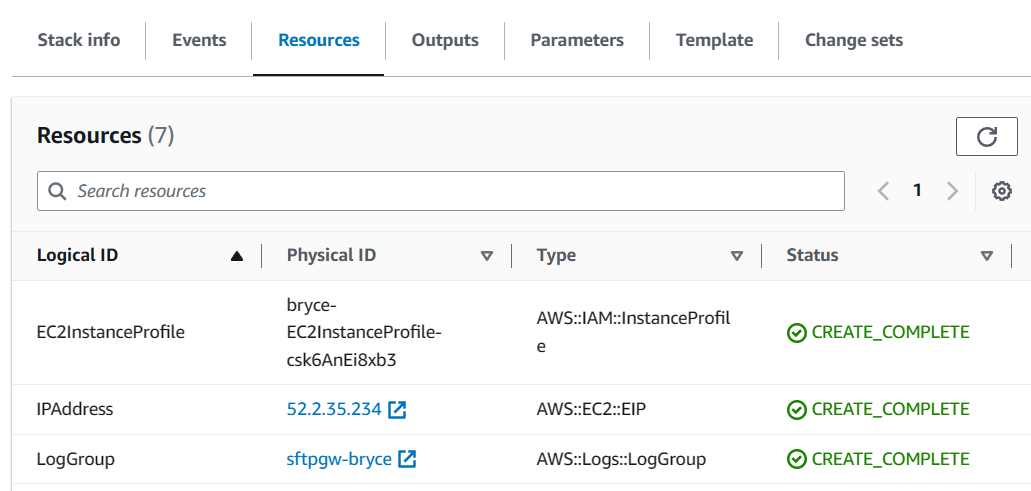
If you spun up SFTP Gateway via CloudFormation, you can find the LogGroup name under the Physical ID category.

Log Files
We brought back a feature from SFTP Gateway version 2, where we display log files within the web admin portal. This is a convenient way to access the log files, without having to SSH into the server.

There are two main log files used by SFTP Gateway:
- SFTP Activity Log: This is the SFTP audit log that records authentication attempts, along with SFTP activity such as traversing directories.
- Server Log: This is the Java
application.logfile that shows errors and stack traces. This log is helpful for troubleshooting difficult issues.
You can filter the log events by setting a Start Date. Use this to narrow down the events that took place after the issue started happening.