SFTP Gateway Log Observability: CloudWatch Integration Guide
TLDR
- Forward CloudWatch logs to Grafana/Loki for enhanced search and visualization
- Ideal for HA deployments with multiple instances sending logs to CloudWatch
- Uses a Python Lambda function to forward logs with instance ID labels
- Enables cross-instance log search and upload tracking per instance
Introduction
If your SFTP Gateway is already sending logs to Amazon CloudWatch, you can add powerful search and visualization capabilities without changing your existing logging setup. This guide shows you how to forward CloudWatch logs to a Grafana/Loki stack for enhanced observability.
This approach is ideal when:
- You have multiple SFTP Gateway instances sending logs to CloudWatch (especially HA deployments)
- You want to centralize logs from multiple HA instances into one dashboard
- You prefer to keep CloudWatch as your primary log storage while adding Grafana for visualization
- You need cross-instance search capabilities (e.g., "find all transfers of invoice.pdf across all instances")
- You want to see which instance handled each file transfer in an HA deployment
By the end of this guide, you'll be able to:
- Search across all SFTP Gateway instances from a single Grafana dashboard
- Track uploads by instance to verify load balancing is working
- Correlate activity across multiple instances
- Keep your existing CloudWatch setup intact (logs flow to both systems)
- Query logs using LogQL for advanced analysis
Architecture Overview
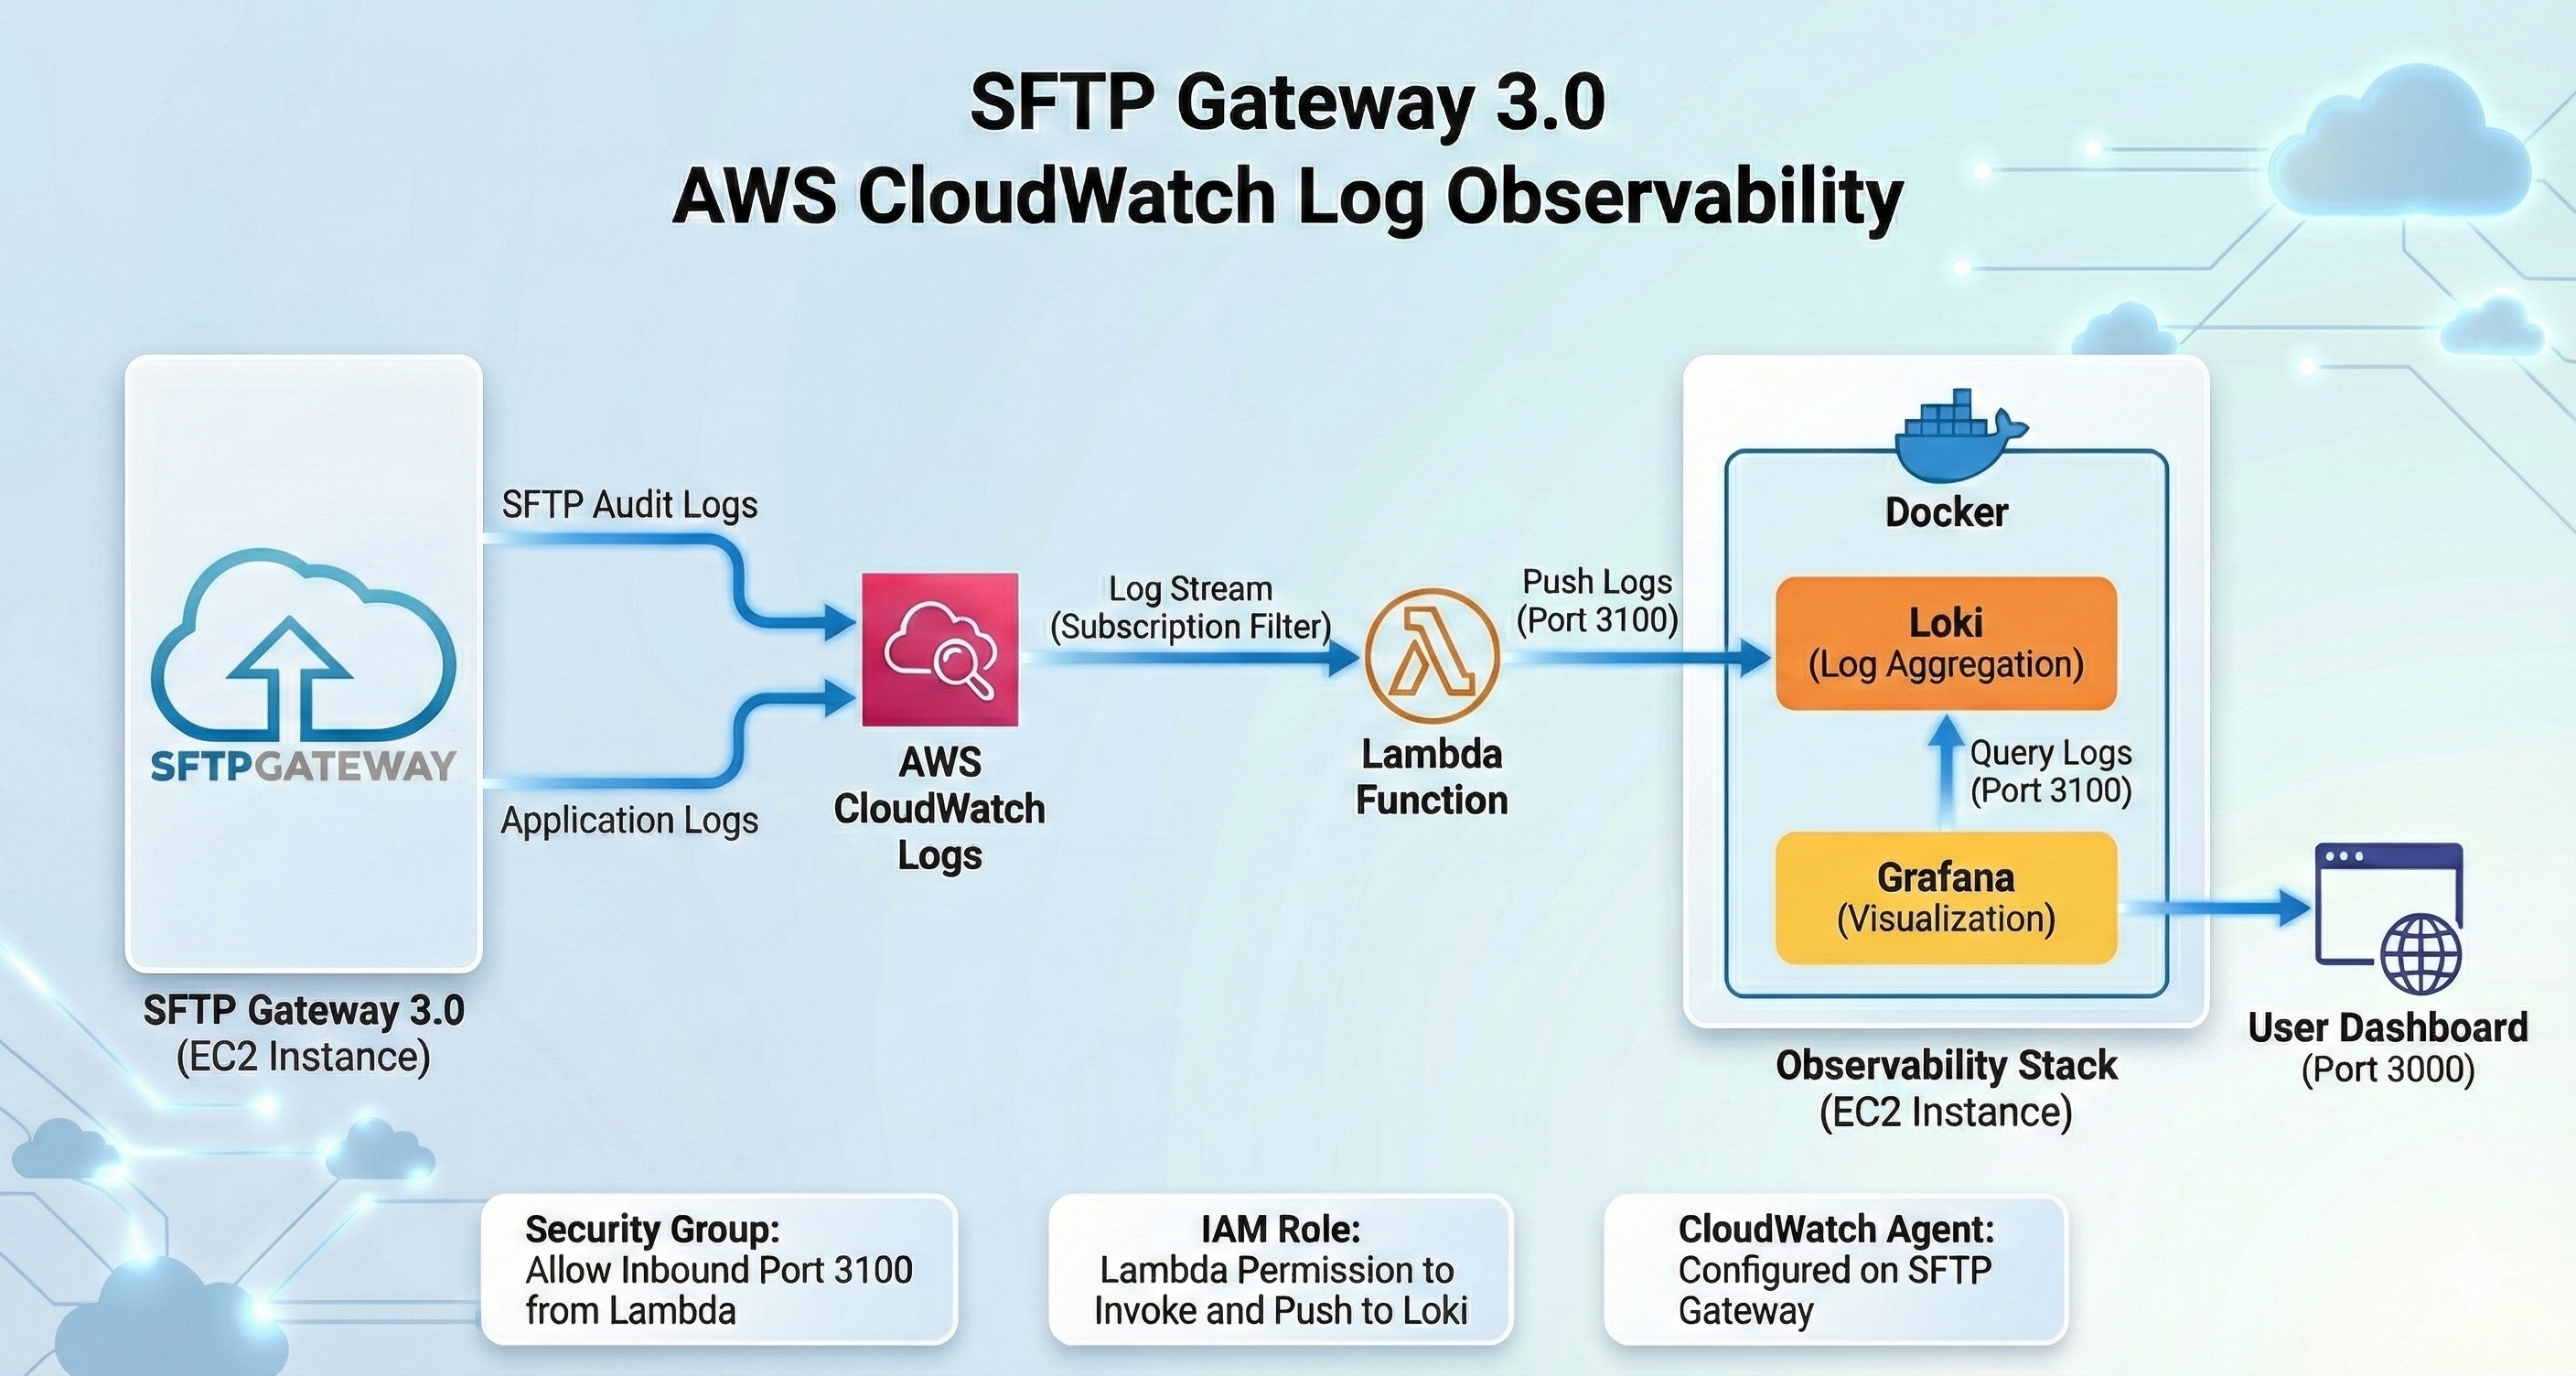
The integration uses a Python AWS Lambda function to forward CloudWatch logs to Loki in real-time:
┌────────────────────────────────────────────────────────────────────────────┐
│  AWS Account                                                               │
│                                                                            │
│  ┌──────────────────────────────────────────────────────────────────────┐  │
│  │  SFTP Gateway HA Deployment                                          │  │
│  │                                                                      │  │
│  │  ┌──────────────┐    ┌──────────────┐    ┌──────────────┐            │  │
│  │  │ Instance 1   │    │ Instance 2   │    │ Instance N   │            │  │
│  │  │ i-abc123...  │    │ i-def456...  │    │ i-ghi789...  │            │  │
│  │  └──────┬───────┘    └──────┬───────┘    └──────┬───────┘            │  │
│  │         │                   │                   │                    │  │
│  │         └───────────────────┼───────────────────┘                    │  │
│  │                             │                                        │  │
│  │                      Network Load Balancer                           │  │
│  └─────────────────────────────┼────────────────────────────────────────┘  │
│                                │                                           │
│                                ▼                                           │
│  ┌──────────────────────────────────────────────────────────────────────┐  │
│  │                       CloudWatch Logs                                │  │
│  │                                                                      │  │
│  │  Log Group: sftpgw-ha-stack                                          │  │
│  │  ┌─────────────────────┐  ┌─────────────────────┐                    │  │
│  │  │ audit-i-abc123...   │  │ audit-i-def456...   │  ...               │  │
│  │  │ (stream per instance)│  │ (stream per instance)│                   │  │
│  │  └─────────┬───────────┘  └─────────┬───────────┘                    │  │
│  │            └────────────────────────┘                                │  │
│  │                         │                                            │  │
│  │                Subscription Filter                                   │  │
│  └─────────────────────────┼────────────────────────────────────────────┘  │
│                            │                                               │
│                            ▼                                               │
│               ┌───────────────────────┐                                    │
│               │     Python Lambda     │                                    │
│               │   CloudWatchToLoki    │                                    │
│               │                       │                                    │
│               │ - Extracts instance_id│                                    │
│               │ - Forwards to Loki    │                                    │
│               └───────────┬───────────┘                                    │
│                           │                                                │
│                           ▼                                                │
│  ┌──────────────────────────────────────────────────────────────────────┐  │
│  │  Observability EC2 Instance                                          │  │
│  │                                                                      │  │
│  │  ┌──────────────┐         ┌──────────────┐                           │  │
│  │  │     Loki     │◀────────│   Grafana    │◀─── You (browser)         │  │
│  │  │   (store)    │         │ (visualize)  │                           │  │
│  │  │    :3100     │         │    :3000     │                           │  │
│  │  └──────────────┘         └──────────────┘                           │  │
│  └──────────────────────────────────────────────────────────────────────┘  │
└────────────────────────────────────────────────────────────────────────────┘
How It Works
- SFTP Gateway instances write audit logs to CloudWatch (your existing setup)
- CloudWatch log streams are named with the instance ID (e.g.,
audit-i-04879542e91d900f1) - CloudWatch Subscription Filter triggers the Lambda function whenever new log events arrive
- Python Lambda extracts the instance ID from the log stream name and forwards logs to Loki with appropriate labels
- Loki stores the logs with labels for efficient querying
- Grafana provides the search and dashboard interface, including "Uploads by Instance" visualization
Component Details
| Component | Purpose | Notes |
|---|---|---|
| CloudWatch Logs | Existing log storage | No changes required to your SFTP Gateway config |
| Python Lambda | Log forwarder | Simple Python function, ~50 lines of code |
| Loki | Log aggregation | Stores logs from all instances with instance_id label |
| Grafana | Visualization | Dashboard shows uploads by instance for HA verification |
Labels Added by Lambda
The Lambda function adds these labels to each log entry:
| Label | Description | Example |
|---|---|---|
job | Fixed identifier | sftpgw |
log_group | CloudWatch log group name | sftpgw-ha-stack |
log_stream | CloudWatch log stream name | audit-i-04879542e91d900f1 |
instance_id | EC2 instance ID (extracted) | i-04879542e91d900f1 |
Prerequisites
Before starting, ensure you have:
- SFTP Gateway logs in CloudWatch - Your instances should already be configured to send logs to CloudWatch
- AWS CLI installed and configured with appropriate permissions
- An EC2 instance for running Loki/Grafana (t3.small or larger recommended)
- S3 bucket for storing the Lambda deployment package
- IAM permissions to:
- Create Lambda functions
- Create CloudWatch subscription filters
- Create IAM roles
- Launch EC2 instances
Installation Steps
Step 1: Deploy the Observability Stack
First, launch an EC2 instance to run Loki and Grafana. You can use any Linux AMI (Amazon Linux 2023 or Ubuntu 24.04 recommended).
What you're doing: Creating an EC2 instance with Docker, Loki, and Grafana pre-configured.
Option A: Using User Data (Recommended)
Launch an EC2 instance with the following user data script. This automatically installs and configures everything on first boot.
Instance requirements:
- AMI: Amazon Linux 2023
- Instance type: t3.small or larger
- Storage: 20GB gp3
- Security group: Allow inbound on ports 22 (SSH), 3100 (Loki), and 3000 (Grafana)
User data script:
#!/bin/bash
set -e

# Install Docker
yum install -y docker
systemctl start docker
systemctl enable docker

# Install Docker Compose
curl -L "https://github.com/docker/compose/releases/download/v2.24.0/docker-compose-linux-x86_64" \
  -o /usr/local/bin/docker-compose
chmod +x /usr/local/bin/docker-compose

# Create directory structure
mkdir -p /opt/observability/{loki,grafana/provisioning/datasources}
cd /opt/observability

# Create Loki config
cat > /opt/observability/loki/loki-config.yaml << 'LOKIEOF'
auth_enabled: false

server:
  http_listen_port: 3100
  grpc_listen_port: 9096

common:
  instance_addr: 127.0.0.1
  path_prefix: /loki
  storage:
    filesystem:
      chunks_directory: /loki/chunks
      rules_directory: /loki/rules
  replication_factor: 1
  ring:
    kvstore:
      store: inmemory

query_range:
  results_cache:
    cache:
      embedded_cache:
        enabled: true
        max_size_mb: 100

schema_config:
  configs:
    - from: 2020-10-24
      store: tsdb
      object_store: filesystem
      schema: v13
      index:
        prefix: index_
        period: 24h

ruler:
  alertmanager_url: http://localhost:9093

limits_config:
  reject_old_samples: false
  reject_old_samples_max_age: 168h
  ingestion_rate_mb: 16
  ingestion_burst_size_mb: 32
LOKIEOF

# Create Grafana datasource config
cat > /opt/observability/grafana/provisioning/datasources/datasources.yaml << 'DSEOF'
apiVersion: 1
datasources:
  - name: Loki
    type: loki
    access: proxy
    url: http://loki:3100
    isDefault: true
DSEOF

# Create Docker Compose file
# IMPORTANT: Loki binds to 0.0.0.0 so Lambda can reach it
cat > /opt/observability/docker-compose.yml << 'COMPOSEEOF'
services:
  loki:
    image: grafana/loki:3.0.0
    container_name: loki
    ports:
      - "0.0.0.0:3100:3100"
    volumes:
      - ./loki/loki-config.yaml:/etc/loki/local-config.yaml:ro
      - loki-data:/loki
    command: -config.file=/etc/loki/local-config.yaml
    restart: unless-stopped

  grafana:
    image: grafana/grafana:11.2.0
    container_name: grafana
    ports:
      - "0.0.0.0:3000:3000"
    environment:
      - GF_SECURITY_ADMIN_PASSWORD=admin
      - GF_AUTH_ANONYMOUS_ENABLED=false
    volumes:
      - ./grafana/provisioning:/etc/grafana/provisioning:ro
      - grafana-data:/var/lib/grafana
    depends_on:
      - loki
    restart: unless-stopped

volumes:
  loki-data:
  grafana-data:
COMPOSEEOF

# Start the stack
docker-compose up -d

echo "Observability stack started. Grafana available on port 3000."
Option B: Manual Installation
If you prefer to set up an existing instance manually, SSH into your instance and run the commands from the user data script above.
Step 2: Configure Security Group
The EC2 instance needs to accept connections from Lambda on port 3100.
What you're doing: Allowing the Lambda function to push logs to Loki.
# Get your security group ID
SECURITY_GROUP_ID=$(aws ec2 describe-instances \
  --instance-ids <YOUR-INSTANCE-ID> \
  --query 'Reservations[0].Instances[0].SecurityGroups[0].GroupId' \
  --output text)

# Allow Loki port from anywhere (Lambda doesn't have a fixed IP)
aws ec2 authorize-security-group-ingress \
  --group-id $SECURITY_GROUP_ID \
  --protocol tcp \
  --port 3100 \
  --cidr 0.0.0.0/0

# Allow Grafana port for your access
aws ec2 authorize-security-group-ingress \
  --group-id $SECURITY_GROUP_ID \
  --protocol tcp \
  --port 3000 \
  --cidr 0.0.0.0/0
Security Note: For production, consider:
- Using a VPC endpoint for Lambda instead of public access
- Restricting Grafana access to your IP range
- Adding an Application Load Balancer with authentication
Step 3: Create the Lambda Function
Create a Python Lambda function to forward CloudWatch logs to Loki. This function extracts the instance ID from the CloudWatch log stream name (e.g., audit-i-04879542e91d900f1 → i-04879542e91d900f1).
What you're doing: Creating a simple Python function that transforms CloudWatch log events into Loki's format.
Create a file named lambda_function.py:
import json
import base64
import gzip
import urllib.request
import os

LOKI_URL = os.environ.get('LOKI_URL', 'http://localhost:3100')

def lambda_handler(event, context):
    # Decode and decompress CloudWatch Logs data
    cw_data = event['awslogs']['data']
    compressed_payload = base64.b64decode(cw_data)
    uncompressed_payload = gzip.decompress(compressed_payload)
    log_data = json.loads(uncompressed_payload)

    log_group = log_data['logGroup']
    log_stream = log_data['logStream']
    log_events = log_data['logEvents']

    # Extract instance ID from log stream (e.g., audit-i-04879542e91d900f1)
    instance_id = "unknown"
    if "-i-" in log_stream:
        parts = log_stream.split("-i-")
        if len(parts) > 1:
            instance_id = "i-" + parts[1]

    # Build Loki push payload
    streams = []
    values = []

    for log_event in log_events:
        timestamp_ns = str(log_event['timestamp'] * 1000000)  # Convert ms to ns
        message = log_event['message']
        values.append([timestamp_ns, message])

    if values:
        streams.append({
            "stream": {
                "job": "sftpgw",
                "log_group": log_group,
                "log_stream": log_stream,
                "instance_id": instance_id
            },
            "values": values
        })

    payload = {"streams": streams}

    # Send to Loki
    url = f"{LOKI_URL}/loki/api/v1/push"
    data = json.dumps(payload).encode('utf-8')

    req = urllib.request.Request(url, data=data, method='POST')
    req.add_header('Content-Type', 'application/json')

    try:
        with urllib.request.urlopen(req, timeout=10) as response:
            print(f"Sent {len(log_events)} events to Loki, status: {response.status}")
    except Exception as e:
        print(f"Error sending to Loki: {e}")
        raise

    return {'statusCode': 200, 'body': f'Forwarded {len(log_events)} events'}
Package and upload to S3:
# Create deployment package
mkdir -p /tmp/cloudwatch-to-loki
cd /tmp/cloudwatch-to-loki

# Save the Python code to lambda_function.py (copy from above)

# Create zip file
zip cloudwatch-to-loki.zip lambda_function.py

# Create S3 bucket and upload
BUCKET_NAME="cloudwatch-to-loki-$(aws sts get-caller-identity --query Account --output text)"
aws s3 mb s3://$BUCKET_NAME 2>/dev/null || true
aws s3 cp cloudwatch-to-loki.zip s3://$BUCKET_NAME/

echo "Lambda package uploaded to s3://$BUCKET_NAME/cloudwatch-to-loki.zip"
Step 4: Deploy Lambda via CloudFormation
What you're doing: Creating the Lambda function, IAM role, and CloudWatch subscription filter using CloudFormation.
Create a file named lambda-cft.yaml:
AWSTemplateFormatVersion: '2010-09-09'
Description: CloudWatch to Loki forwarder Lambda

Parameters:
  LokiUrl:
    Type: String
    Description: Loki push URL (e.g., http://1.2.3.4:3100)
  S3Bucket:
    Type: String
    Description: S3 bucket containing the Lambda zip
  LogGroupName:
    Type: String
    Description: CloudWatch Log Group to subscribe

Resources:
  LambdaRole:
    Type: AWS::IAM::Role
    Properties:
      RoleName: CloudWatchToLokiRole
      AssumeRolePolicyDocument:
        Version: '2012-10-17'
        Statement:
          - Effect: Allow
            Principal:
              Service: lambda.amazonaws.com
            Action: sts:AssumeRole
      Policies:
        - PolicyName: LogsPolicy
          PolicyDocument:
            Version: '2012-10-17'
            Statement:
              - Effect: Allow
                Action:
                  - logs:CreateLogGroup
                  - logs:CreateLogStream
                  - logs:PutLogEvents
                Resource: arn:aws:logs:*:*:*

  LambdaFunction:
    Type: AWS::Lambda::Function
    Properties:
      FunctionName: CloudWatchToLoki
      Runtime: python3.12
      Handler: lambda_function.lambda_handler
      Code:
        S3Bucket: !Ref S3Bucket
        S3Key: cloudwatch-to-loki.zip
      Role: !GetAtt LambdaRole.Arn
      Timeout: 60
      MemorySize: 128
      Environment:
        Variables:
          LOKI_URL: !Ref LokiUrl

  LambdaPermission:
    Type: AWS::Lambda::Permission
    Properties:
      FunctionName: !GetAtt LambdaFunction.Arn
      Action: lambda:InvokeFunction
      Principal: !Sub logs.${AWS::Region}.amazonaws.com

  SubscriptionFilter:
    Type: AWS::Logs::SubscriptionFilter
    DependsOn: LambdaPermission
    Properties:
      LogGroupName: !Ref LogGroupName
      FilterPattern: ""
      DestinationArn: !GetAtt LambdaFunction.Arn

Outputs:
  LambdaArn:
    Value: !GetAtt LambdaFunction.Arn
Deploy the stack:
# Get your EC2 instance's public IP
EC2_IP=$(aws ec2 describe-instances \
  --instance-ids <YOUR-INSTANCE-ID> \
  --query 'Reservations[0].Instances[0].PublicIpAddress' \
  --output text)

# Get your S3 bucket name
BUCKET_NAME="cloudwatch-to-loki-$(aws sts get-caller-identity --query Account --output text)"

# Deploy the CloudFormation stack
aws cloudformation create-stack \
  --stack-name cloudwatch-to-loki \
  --template-body file://lambda-cft.yaml \
  --capabilities CAPABILITY_NAMED_IAM \
  --parameters \
    ParameterKey=LokiUrl,ParameterValue="http://${EC2_IP}:3100" \
    ParameterKey=S3Bucket,ParameterValue="${BUCKET_NAME}" \
    ParameterKey=LogGroupName,ParameterValue="<YOUR-LOG-GROUP-NAME>"

# Wait for completion
aws cloudformation wait stack-create-complete --stack-name cloudwatch-to-loki
echo "Lambda deployed successfully!"
Replace <YOUR-LOG-GROUP-NAME> with your SFTP Gateway's CloudWatch log group name (e.g., sftpgw-ha-stack).
Step 5: Add Additional Log Groups (Optional)
To forward logs from multiple SFTP Gateway deployments (not just multiple instances within one HA deployment), add subscription filters for each log group.
What you're doing: Connecting additional CloudWatch log groups to the same Lambda function.
# Get the Lambda ARN
LAMBDA_ARN=$(aws lambda get-function \
  --function-name CloudWatchToLoki \
  --query 'Configuration.FunctionArn' \
  --output text)

# Add permission for the new log group
aws lambda add-permission \
  --function-name CloudWatchToLoki \
  --statement-id "allow-logs-<UNIQUE-ID>" \
  --principal "logs.$(aws configure get region).amazonaws.com" \
  --action "lambda:InvokeFunction"

# Create subscription filter for additional log group
aws logs put-subscription-filter \
  --log-group-name "<ANOTHER-LOG-GROUP>" \
  --filter-name "cloudwatch-to-loki" \
  --filter-pattern "" \
  --destination-arn "$LAMBDA_ARN"
Repeat for each SFTP Gateway log group you want to include.
Verification
Step 6: Verify Logs Are Flowing
What you're doing: Confirming that logs are being forwarded from CloudWatch to Loki.
Generate Test Activity
Trigger some SFTP activity on your gateway (connect, upload a file, disconnect). This creates new CloudWatch log events that should flow to Loki.
# Example: upload test files via SFTP
for i in {1..5}; do
  echo "Test upload $i - $(date)" > /tmp/test-$i.txt
  sftp -o StrictHostKeyChecking=no user@your-sftp-gateway.example.com <<EOF
put /tmp/test-$i.txt
quit
EOF
  sleep 2
done
Check Lambda Execution
# View recent Lambda invocations
aws logs filter-log-events \
  --log-group-name /aws/lambda/CloudWatchToLoki \
  --start-time $(date -d '5 minutes ago' +%s000 2>/dev/null || date -v-5M +%s000) \
  --query 'events[*].message' \
  --output text
You should see invocation logs indicating the function processed events successfully, like:
Sent 3 events to Loki, status: 204
Check Loki Labels
# Query Loki to verify labels
EC2_IP="<YOUR-EC2-IP>"
curl -s "http://${EC2_IP}:3100/loki/api/v1/labels" | jq .
Expected output includes labels like job, instance_id, log_group, log_stream.
Query Logs via Loki API
# Query logs for the sftpgw job
curl -s "http://${EC2_IP}:3100/loki/api/v1/query_range" \
  --data-urlencode 'query={job="sftpgw"}' \
  --data-urlencode "start=$(date -d '1 hour ago' +%s 2>/dev/null || date -v-1H +%s)" \
  --data-urlencode "end=$(date +%s)" \
  --data-urlencode "limit=5" | jq '.data.result[0].values[:3]'
Access Grafana
- Open your browser to
http://<EC2-IP>:3000 - Log in with username
adminand passwordadmin(or the password you configured) - Go to Explore (compass icon in the left sidebar)
- Select Loki as the data source
- Run a query:
{job="sftpgw"}
You should see your SFTP Gateway logs with instance_id labels.
Using Grafana
Querying CloudWatch-Sourced Logs
Logs forwarded by the Python Lambda have these labels:
| Label | Description | Example |
|---|---|---|
job | Fixed identifier for SFTP Gateway | sftpgw |
log_group | CloudWatch log group name | sftpgw-ha-stack |
log_stream | CloudWatch log stream name | audit-i-04879542e91d900f1 |
instance_id | EC2 instance ID (extracted from stream) | i-04879542e91d900f1 |
Example Queries
View all logs from all SFTP Gateway instances:
{job="sftpgw"}
View logs from a specific instance:
{job="sftpgw", instance_id="i-04879542e91d900f1"}
Search for a filename across all instances:
{job="sftpgw"} |= "invoice.pdf"
Find file uploads:
{job="sftpgw"} |= "SFTP_FILE_UPLOAD_COMPLETE"
Count uploads per instance (verify load balancing):
sum by (instance_id) (
  count_over_time({job="sftpgw"} |= "SFTP_FILE_UPLOAD_COMPLETE" [1h])
)
Find failed authentication attempts:
{job="sftpgw"} |= "USERAUTH_FAILURE"
Extract fields from JSON logs:
{job="sftpgw"} |= "SFTP_FILE_UPLOAD_COMPLETE" | json | line_format "{{.username}} uploaded {{.file_name}}"
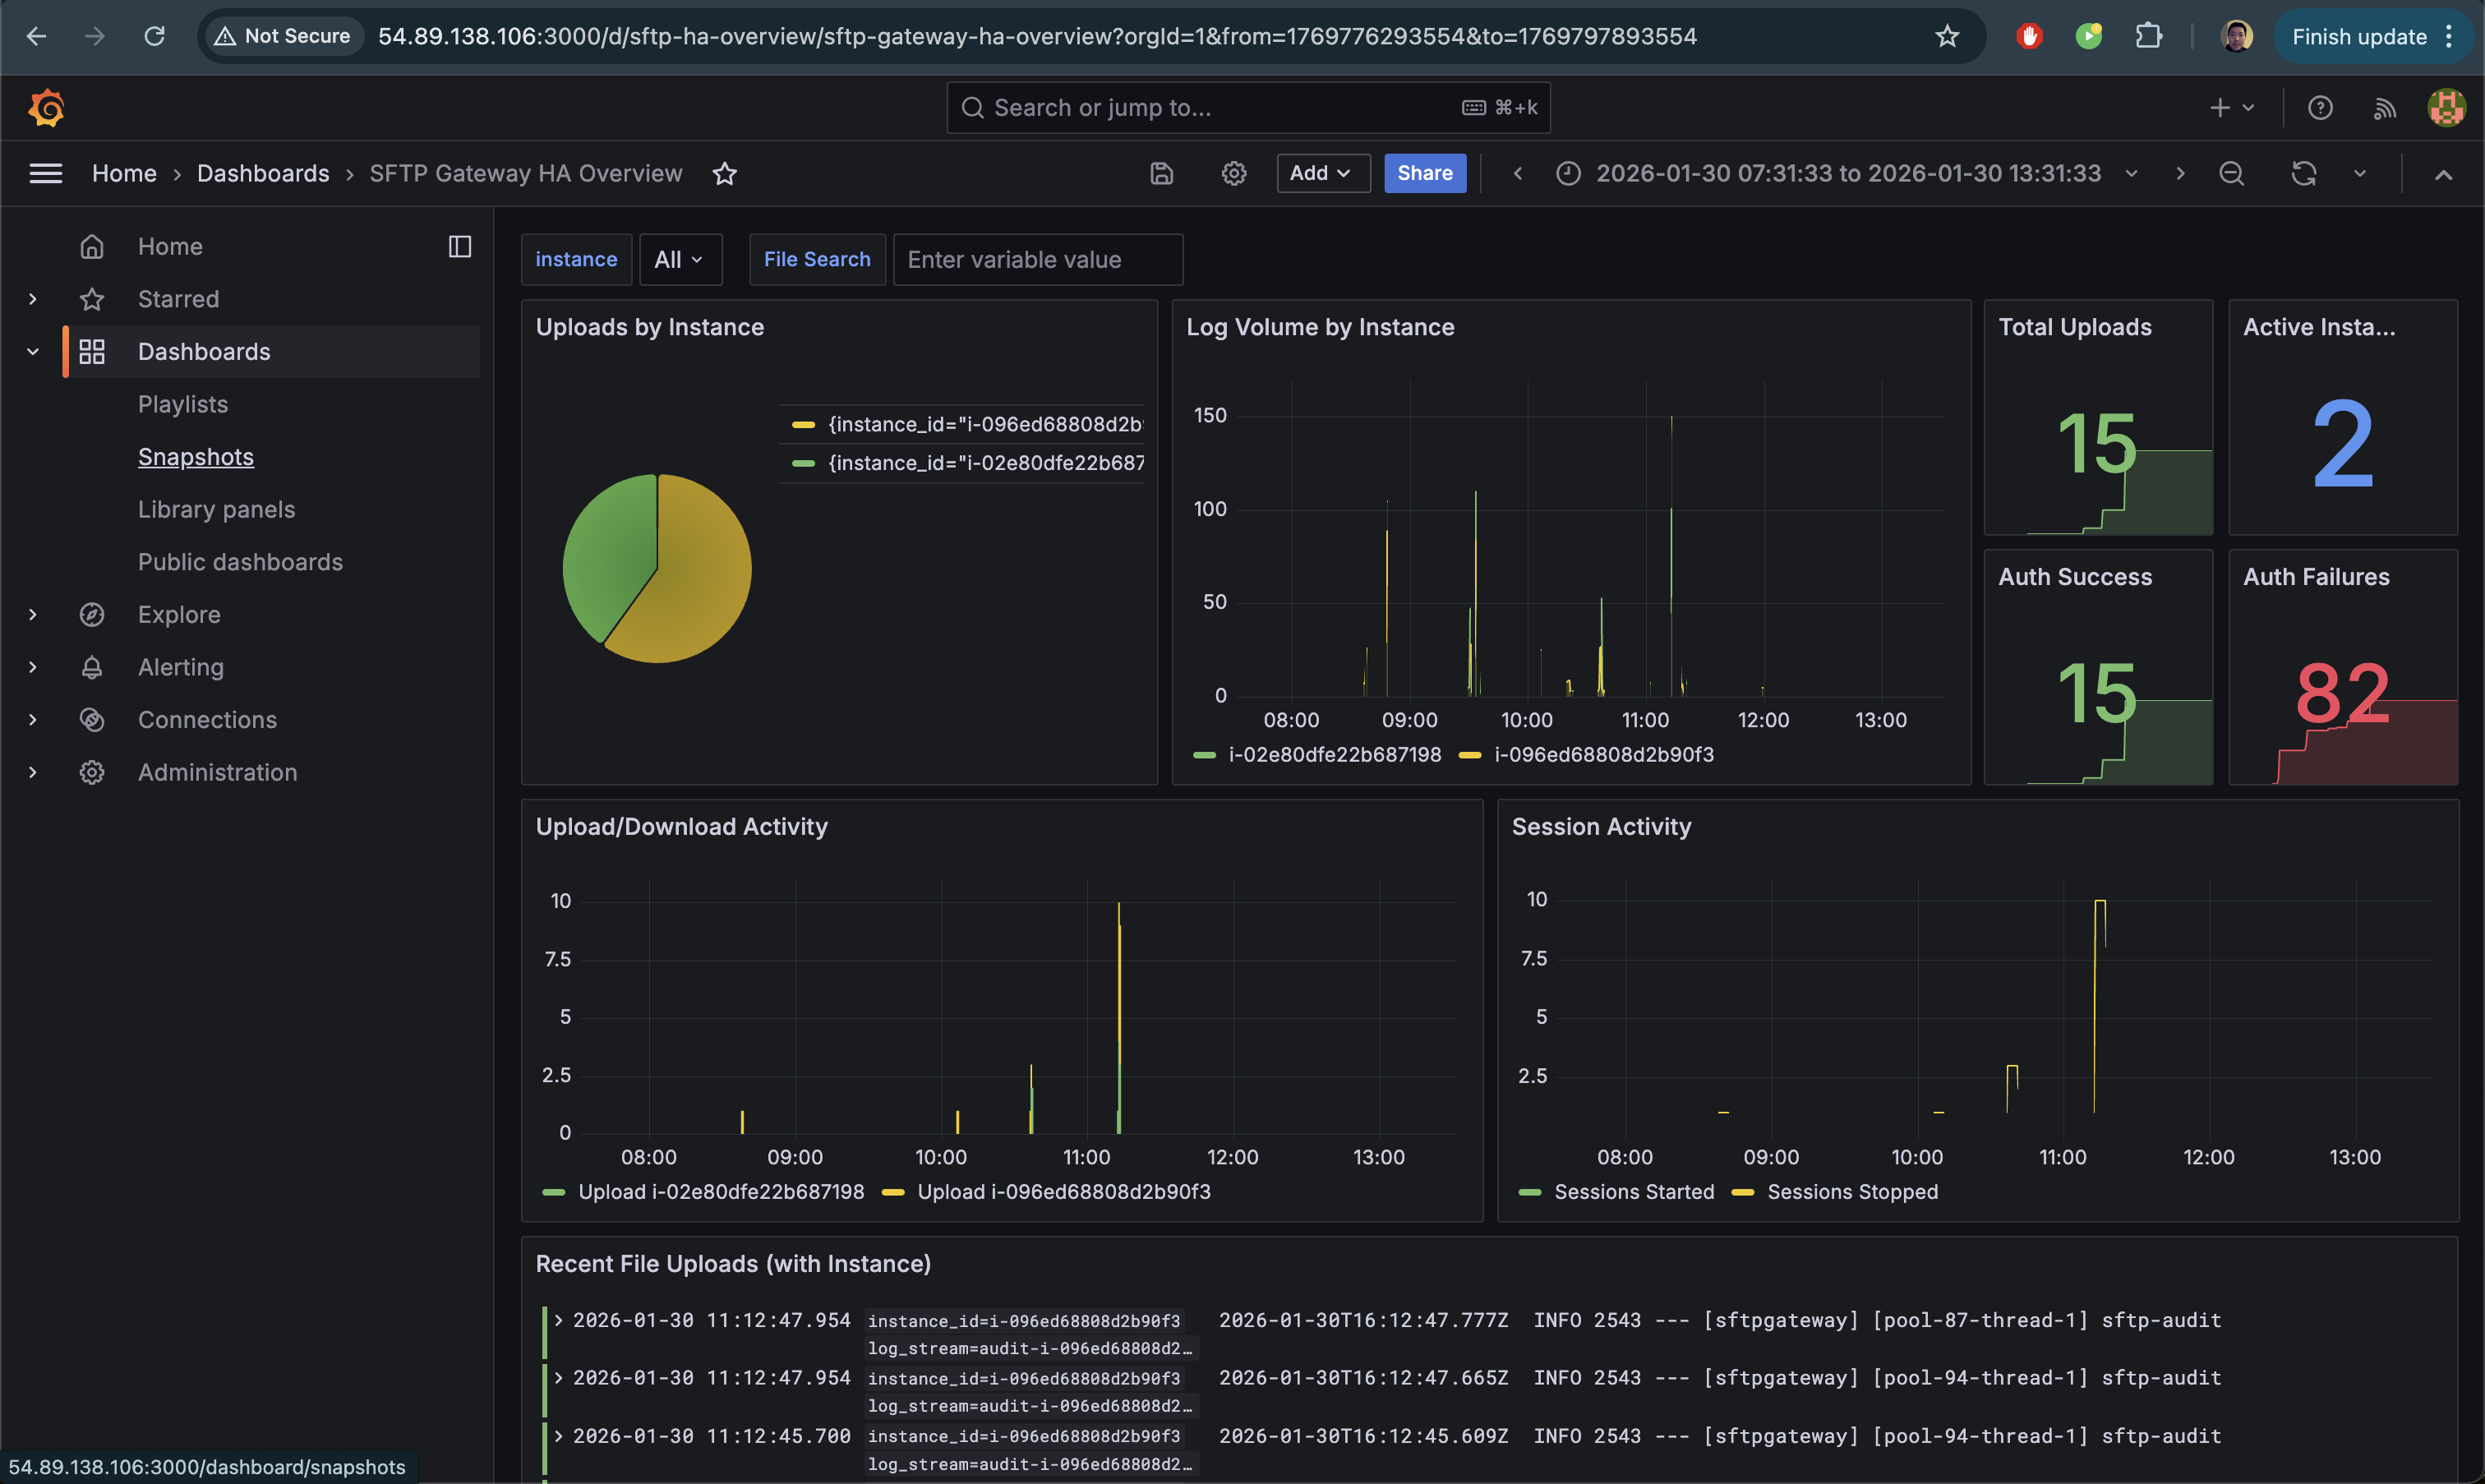
Creating an HA Dashboard
For HA deployments, create a dashboard that shows upload distribution across instances.
- In Grafana, go to Dashboards → New → Import
- Paste the following dashboard JSON:
{
  "uid": "sftp-ha-overview",
  "title": "SFTP Gateway HA Overview",
  "tags": ["sftp", "ha", "cloudwatch"],
  "timezone": "browser",
  "schemaVersion": 39,
  "refresh": "10s",
  "time": {
    "from": "now-1h",
    "to": "now"
  },
  "panels": [
    {
      "id": 1,
      "title": "Uploads by Instance",
      "description": "Shows how uploads are distributed across HA instances",
      "type": "timeseries",
      "gridPos": { "h": 8, "w": 12, "x": 0, "y": 0 },
      "datasource": { "type": "loki", "uid": "loki" },
      "targets": [
        {
          "expr": "sum by (instance_id) (count_over_time({job=\"sftpgw\"} |= \"SFTP_FILE_UPLOAD_COMPLETE\" [1m]))",
          "legendFormat": "{{instance_id}}",
          "refId": "A"
        }
      ],
      "fieldConfig": {
        "defaults": {
          "color": { "mode": "palette-classic" },
          "unit": "short"
        }
      },
      "options": {
        "legend": { "displayMode": "list", "placement": "bottom" }
      }
    },
    {
      "id": 2,
      "title": "Total Uploads by Instance",
      "description": "Pie chart showing upload distribution",
      "type": "piechart",
      "gridPos": { "h": 8, "w": 6, "x": 12, "y": 0 },
      "datasource": { "type": "loki", "uid": "loki" },
      "targets": [
        {
          "expr": "sum by (instance_id) (count_over_time({job=\"sftpgw\"} |= \"SFTP_FILE_UPLOAD_COMPLETE\" [$__range]))",
          "legendFormat": "{{instance_id}}",
          "refId": "A"
        }
      ],
      "options": {
        "legend": {
          "displayMode": "table",
          "placement": "right",
          "values": ["value", "percent"]
        }
      }
    },
    {
      "id": 3,
      "title": "Active Instances",
      "type": "stat",
      "gridPos": { "h": 4, "w": 6, "x": 18, "y": 0 },
      "datasource": { "type": "loki", "uid": "loki" },
      "targets": [
        {
          "expr": "count(sum by (instance_id) (count_over_time({job=\"sftpgw\"} [$__range])))",
          "legendFormat": "Instances",
          "refId": "A"
        }
      ],
      "options": {
        "colorMode": "value",
        "graphMode": "none"
      }
    },
    {
      "id": 4,
      "title": "Total Events",
      "type": "stat",
      "gridPos": { "h": 4, "w": 6, "x": 18, "y": 4 },
      "datasource": { "type": "loki", "uid": "loki" },
      "targets": [
        {
          "expr": "sum(count_over_time({job=\"sftpgw\"} [$__range]))",
          "legendFormat": "Events",
          "refId": "A"
        }
      ],
      "options": {
        "colorMode": "value",
        "graphMode": "area"
      }
    },
    {
      "id": 5,
      "title": "Log Volume by Instance",
      "type": "timeseries",
      "gridPos": { "h": 8, "w": 12, "x": 0, "y": 8 },
      "datasource": { "type": "loki", "uid": "loki" },
      "targets": [
        {
          "expr": "sum by (instance_id) (count_over_time({job=\"sftpgw\"} [1m]))",
          "legendFormat": "{{instance_id}}",
          "refId": "A"
        }
      ],
      "fieldConfig": {
        "defaults": {
          "color": { "mode": "palette-classic" },
          "unit": "short"
        }
      }
    },
    {
      "id": 6,
      "title": "Auth Failures by Instance",
      "type": "timeseries",
      "gridPos": { "h": 8, "w": 12, "x": 12, "y": 8 },
      "datasource": { "type": "loki", "uid": "loki" },
      "targets": [
        {
          "expr": "sum by (instance_id) (count_over_time({job=\"sftpgw\"} |= \"USERAUTH_FAILURE\" [5m]))",
          "legendFormat": "{{instance_id}}",
          "refId": "A"
        }
      ],
      "fieldConfig": {
        "defaults": {
          "color": { "fixedColor": "red", "mode": "fixed" }
        }
      }
    },
    {
      "id": 7,
      "title": "Recent Activity Logs",
      "type": "logs",
      "gridPos": { "h": 10, "w": 24, "x": 0, "y": 16 },
      "datasource": { "type": "loki", "uid": "loki" },
      "targets": [
        {
          "expr": "{job=\"sftpgw\"}",
          "refId": "A"
        }
      ],
      "options": {
        "showTime": true,
        "showLabels": true,
        "showCommonLabels": false,
        "wrapLogMessage": true,
        "prettifyLogMessage": false,
        "enableLogDetails": true,
        "dedupStrategy": "none",
        "sortOrder": "Descending"
      }
    }
  ]
}
- Click Load then Import
Once imported, your dashboard will show real-time metrics across all SFTP Gateway instances:
Troubleshooting
Lambda Not Triggering
Symptom: No Lambda invocations in CloudWatch Logs.
Check: Verify the subscription filter exists:
aws logs describe-subscription-filters \
  --log-group-name "<YOUR-LOG-GROUP>"
Solution: Re-create the subscription filter with the correct Lambda ARN.
Lambda Errors
Symptom: Lambda invocations fail with errors.
Check: View Lambda logs:
aws logs filter-log-events \
  --log-group-name /aws/lambda/CloudWatchToLoki \
  --start-time $(date -d '10 minutes ago' +%s000 2>/dev/null || date -v-10M +%s000)
Common issues:
connection refused- Loki isn't running or security group doesn't allow port 3100timeout- EC2 instance is stopped or unreachableURLError- Check that the LOKI_URL environment variable is correct
No Logs in Loki
Symptom: Lambda succeeds but Loki shows no data.
Check: Test Loki is accepting pushes:
curl -v -X POST "http://<EC2-IP>:3100/loki/api/v1/push" \
  -H "Content-Type: application/json" \
  -d '{"streams":[{"stream":{"test":"true"},"values":[["'$(date +%s)000000000'","test log"]]}]}'
Solution: Ensure Loki is running and binding to 0.0.0.0:3100 (not 127.0.0.1).
Instance ID Shows as "unknown"
Symptom: The instance_id label is "unknown" instead of the actual instance ID.
Check: Verify your CloudWatch log stream names contain the instance ID pattern (e.g., audit-i-04879542e91d900f1).
Solution: The Lambda extracts instance IDs from log stream names containing -i-. If your log streams use a different naming convention, modify the Lambda function's extraction logic.
EC2 IP Changed
Symptom: Lambda can't reach Loki after EC2 restart.
Solution: Update the Lambda environment variable:
NEW_IP=$(aws ec2 describe-instances \
  --instance-ids <YOUR-INSTANCE-ID> \
  --query 'Reservations[0].Instances[0].PublicIpAddress' \
  --output text)

aws lambda update-function-configuration \
  --function-name CloudWatchToLoki \
  --environment "Variables={LOKI_URL=http://${NEW_IP}:3100}"
Better solution: Use an Elastic IP for the observability instance.
Production Considerations
Use an Elastic IP
Assign an Elastic IP to the observability EC2 instance so the IP doesn't change on restart:
# Allocate Elastic IP
ALLOCATION_ID=$(aws ec2 allocate-address --domain vpc --query 'AllocationId' --output text)

# Associate with instance
aws ec2 associate-address \
  --instance-id <YOUR-INSTANCE-ID> \
  --allocation-id $ALLOCATION_ID
Enable HTTPS for Grafana
Add an nginx reverse proxy with SSL certificate for secure Grafana access. See the AWS Single Instance Setup Guide for nginx configuration details.
Log Retention
Configure Loki retention to manage storage:
# In loki-config.yaml
limits_config:
  retention_period: 30d  # Keep logs for 30 days

compactor:
  retention_enabled: true
Monitoring Lambda
Set up CloudWatch alarms for Lambda errors:
aws cloudwatch put-metric-alarm \
  --alarm-name "CloudWatchToLoki-Errors" \
  --metric-name Errors \
  --namespace AWS/Lambda \
  --statistic Sum \
  --period 300 \
  --threshold 1 \
  --comparison-operator GreaterThanOrEqualToThreshold \
  --dimensions Name=FunctionName,Value=CloudWatchToLoki \
  --evaluation-periods 1 \
  --alarm-actions <YOUR-SNS-TOPIC-ARN>
Cleanup
To remove the CloudWatch integration:
# Delete CloudFormation stack (removes Lambda, IAM role, subscription filter)
aws cloudformation delete-stack --stack-name cloudwatch-to-loki

# Delete S3 bucket
BUCKET_NAME="cloudwatch-to-loki-$(aws sts get-caller-identity --query Account --output text)"
aws s3 rm s3://$BUCKET_NAME --recursive
aws s3 rb s3://$BUCKET_NAME

# Stop/terminate the observability EC2 instance
aws ec2 terminate-instances --instance-ids <YOUR-INSTANCE-ID>
Summary
You've now set up a CloudWatch → Loki integration that:
- Forwards SFTP Gateway logs from CloudWatch to Loki in real-time
- Extracts instance IDs from log stream names for HA visibility
- Preserves your existing CloudWatch logging setup
- Enables cross-instance search and visualization in Grafana
- Shows which instance handled each upload for HA verification
- Scales to multiple SFTP Gateway deployments
For questions or issues, contact support or refer to the Grafana Loki documentation.