SFTP Gateway Log Observability Setup Guide (AWS Single Instance)
TLDR
- Install Docker and Docker Compose on your SFTP Gateway EC2 instance
- Deploy Loki (log storage), Alloy (log collection), and Grafana (visualization) using Docker Compose
- Configure nginx to proxy Grafana at
/grafana/- Access dashboards at
https://<your-server>/grafana/to search logs, monitor failed logins, and track file transfers- Write custom LogQL queries to find specific files, users, or IP addresses
Introduction
SFTP Gateway generates detailed audit logs for every file transfer, authentication attempt, and session activity. However, these logs are stored as plain text files on disk, making it difficult to search, analyze, and monitor file transfer activity across your organization.
This guide walks you through setting up a complete log observability stack that transforms these raw logs into searchable, queryable data with real-time dashboards. By the end of this guide, you'll be able to:
- Search for any file transferred through SFTP Gateway by filename, user, or IP address
- Monitor failed login attempts and identify potential security threats
- Track data transfer volumes by user to understand usage patterns
- Visualize activity trends over time with interactive dashboards
- Query logs programmatically using LogQL for custom reporting
The entire stack runs on your existing SFTP Gateway EC2 instance, requiring no additional infrastructure.
Architecture Overview
The observability stack consists of four components that work together to collect, store, and visualize your SFTP Gateway logs:
| Component | Purpose | Port |
|---|---|---|
| Alloy | Watches SFTP Gateway log files, parses each line to extract structured fields (username, action, IP address, etc.), and forwards them to Loki | 12345 (internal) |
| Loki | Stores logs in a compressed, indexed format optimized for fast querying. Think of it as "Prometheus for logs" | 3100 (internal) |
| Grafana | Provides the web interface for searching logs, building dashboards, and setting up alerts | 3000 (internal) |
| nginx | Acts as a reverse proxy, allowing secure HTTPS access to Grafana through the existing SFTP Gateway web server | 443 (external) |
How Data Flows Through the Stack
┌──────────────────────────────────────────────────────────────────┐
│  SFTP Gateway EC2 Instance                                       │
│                                                                  │
│  /opt/sftpgw/log/*.log                                           │
│         │                                                        │
│         ▼                                                        │
│  ┌─────────────┐    ┌──────────────┐    ┌──────────────┐         │
│  │   Alloy     │───▶│     Loki     │◀───│   Grafana    │◀─┐      │
│  │  (collect)  │    │   (store)    │    │ (visualize)  │  │      │
│  └─────────────┘    └──────────────┘    └──────────────┘  │      │
│                                                           │      │
│                     ┌───────────────┐                     │      │
│   Internet ────────▶│    nginx      │─────────────────────┘      │
│                     │  :443 (HTTPS) │  /grafana/                 │
│                     └───────────────┘                            │
└──────────────────────────────────────────────────────────────────┘
- SFTP Gateway writes audit logs to
/opt/sftpgw/log/as users connect, authenticate, and transfer files - Alloy continuously monitors these log files, parsing each line to extract structured data like usernames, IP addresses, filenames, and bytes transferred
- Loki receives the parsed logs and stores them efficiently, indexing key fields for fast searching
- Grafana queries Loki to display logs in dashboards and respond to search queries
- nginx provides secure external access to Grafana over HTTPS
Prerequisites
Before starting, ensure you have:
- An SFTP Gateway EC2 instance running Amazon Linux 2023
- SSH access to the instance (SFTP Gateway uses port 2222 for SSH)
- Root/sudo privileges on the instance
- Approximately 10GB of free disk space for log storage
Installation Steps
Step 1: Install Docker
Docker provides containerization, allowing us to run Loki, Alloy, and Grafana as isolated services without installing them directly on the host system. This makes the stack easy to upgrade, maintain, and remove if needed.
What you're doing: Installing the Docker engine and configuring it to start automatically when the server boots.
sudo yum install -y docker
sudo systemctl start docker
sudo systemctl enable docker
sudo usermod -aG docker ec2-user
The last command adds your user to the docker group so you can run Docker commands without sudo. For this to take effect, log out and back in, or run:
newgrp docker
Step 2: Install Docker Compose
Docker Compose allows us to define all three services (Loki, Alloy, Grafana) in a single configuration file and manage them together. Instead of running three separate docker run commands with complex options, we can simply run docker-compose up.
What you're doing: Downloading the Docker Compose binary and making it executable.
sudo curl -L "https://github.com/docker/compose/releases/download/v2.24.0/docker-compose-linux-x86_64" \
  -o /usr/local/bin/docker-compose
sudo chmod +x /usr/local/bin/docker-compose
Verify the installation:
docker-compose --version
Step 3: Create the Directory Structure
Before creating configuration files, we need to set up a directory structure to organize them. All observability-related files will live under /opt/observability/.
What you're doing: Creating directories for each component's configuration files.
sudo mkdir -p /opt/observability/{loki,alloy,grafana/provisioning/datasources,grafana/provisioning/dashboards/json}
sudo chown -R ec2-user:ec2-user /opt/observability
This creates:
/opt/observability/loki/- Loki's configuration/opt/observability/alloy/- Alloy's log parsing configuration/opt/observability/grafana/provisioning/- Grafana's auto-configuration for datasources and dashboards
Step 4: Create the Configuration Files
This step creates all the configuration files that define how each component behaves. We'll create six files total:
- docker-compose.yml - Defines all three services and how they connect
- loki-config.yaml - Configures Loki's storage and retention settings
- config.alloy - Tells Alloy how to parse SFTP Gateway logs
- datasources.yaml - Connects Grafana to Loki automatically
- dashboards.yaml - Tells Grafana where to find dashboard definitions
- sftp-overview.json - The pre-built SFTP Gateway dashboard
Docker Compose Configuration
File: /opt/observability/docker-compose.yml
This file defines the three containers and how they interact. Key points:
- Loki starts first (other services depend on it)
- Alloy mounts the SFTP Gateway log directory as read-only
- Grafana binds only to localhost (nginx will proxy external requests)
services:
  loki:
    image: grafana/loki:3.0.0
    container_name: loki
    ports:
      - "3100:3100"
    volumes:
      - ./loki/loki-config.yaml:/etc/loki/local-config.yaml:ro
      - loki-data:/loki
    command: -config.file=/etc/loki/local-config.yaml
    healthcheck:
      test: ["CMD-SHELL", "wget --no-verbose --tries=1 --spider http://localhost:3100/ready || exit 1"]
      interval: 10s
      timeout: 5s
      retries: 5
    networks:
      - observability

  alloy:
    image: grafana/alloy:v1.4.2
    container_name: alloy
    ports:
      - "12345:12345"
    volumes:
      - ./alloy/config.alloy:/etc/alloy/config.alloy:ro
      - /opt/sftpgw/log:/var/log/sftp-gateway:ro
    command:
      - run
      - /etc/alloy/config.alloy
      - --server.http.listen-addr=0.0.0.0:12345
    depends_on:
      loki:
        condition: service_healthy
    networks:
      - observability

  grafana:
    image: grafana/grafana:11.2.0
    container_name: grafana
    ports:
      - "127.0.0.1:3000:3000"
    environment:
      - GF_SECURITY_ADMIN_USER=admin
      - GF_SECURITY_ADMIN_PASSWORD=admin
      - GF_USERS_ALLOW_SIGN_UP=false
      - GF_SERVER_PROTOCOL=http
      - GF_SERVER_ROOT_URL=https://YOUR_SERVER_IP_OR_HOSTNAME/grafana/
      - GF_SERVER_SERVE_FROM_SUB_PATH=true
    volumes:
      - ./grafana/provisioning:/etc/grafana/provisioning:ro
      - grafana-data:/var/lib/grafana
    depends_on:
      loki:
        condition: service_healthy
    networks:
      - observability

volumes:
  loki-data:
  grafana-data:

networks:
  observability:
    driver: bridge
Loki Configuration
File: /opt/observability/loki/loki-config.yaml
Loki is configured for single-instance deployment with filesystem storage. Key settings:
- retention_period: 744h - Logs are kept for 31 days before automatic deletion
- ingestion_rate_mb: 16 - Allows bursts of log data during high activity
- embedded_cache - Speeds up repeated queries
auth_enabled: false

server:
  http_listen_port: 3100
  grpc_listen_port: 9096
  log_level: info

common:
  instance_addr: 127.0.0.1
  path_prefix: /loki
  storage:
    filesystem:
      chunks_directory: /loki/chunks
      rules_directory: /loki/rules
  replication_factor: 1
  ring:
    kvstore:
      store: inmemory

query_range:
  results_cache:
    cache:
      embedded_cache:
        enabled: true
        max_size_mb: 100

schema_config:
  configs:
    - from: 2024-01-01
      store: tsdb
      object_store: filesystem
      schema: v13
      index:
        prefix: index_
        period: 24h

storage_config:
  tsdb_shipper:
    active_index_directory: /loki/tsdb-index
    cache_location: /loki/tsdb-cache

limits_config:
  retention_period: 744h  # 31 days
  reject_old_samples: true
  reject_old_samples_max_age: 168h
  ingestion_rate_mb: 16
  ingestion_burst_size_mb: 32

analytics:
  reporting_enabled: false
Alloy Log Parsing Configuration
File: /opt/observability/alloy/config.alloy
This is the most important configuration file. Alloy watches the SFTP Gateway log files and uses regex patterns to extract structured fields from each log line.
What gets extracted:
action- The type of event (e.g., SFTP_FILE_UPLOAD_COMPLETE, AUTHENTICATION_STARTED)username- The SFTP user performing the actionremote_ip- The client's IP addressfile_path- The file being transferredbytes_transferred- Size of the transfer in bytesauth_method- How the user authenticated (password, key, etc.)
These extracted fields become searchable labels in Loki, enabling queries like "show me all uploads by user X from IP Y".
// Alloy Configuration for SFTP Gateway Log Collection

local.file_match "sftp_logs" {
  path_targets = [{
    __path__ = "/var/log/sftp-gateway/*.log",
    job      = "sftp-gateway",
    env      = "production",
  }]
}

loki.source.file "sftp_audit" {
  targets    = local.file_match.sftp_logs.targets
  forward_to = [loki.process.sftp_parser.receiver]
}

loki.process "sftp_parser" {
  forward_to = [loki.write.local_loki.receiver]

  // First, match only sftp-audit log lines and extract the action
  stage.match {
    selector = "{job=\"sftp-gateway\"}"
    pipeline_name = "sftp-audit-filter"

    stage.regex {
      expression = "^(?P<timestamp>\\S+)\\s+(?P<level>\\w+)\\s+\\d+\\s+---\\s+\\[\\w+\\]\\s+\\[(?P<thread>[^\\]]+)\\]\\s+sftp-audit\\s+:\\s+(?P<action>\\S+)(?P<rest>.*)$"
    }

    // Drop lines that aren't sftp-audit entries
    stage.drop {
      expression = "^$"
      source = "action"
      drop_counter_reason = "not_sftp_audit"
    }
  }

  // Extract additional fields from the log line
  stage.regex {
    source = "rest"
    expression = "REMOTE_(?:ADDRESS|IP):\\s*(?P<remote_ip>[\\d\\.]+)"
  }

  stage.regex {
    source = "rest"
    expression = "USERNAME:\\s*(?P<username>\\S+)"
  }

  stage.regex {
    source = "rest"
    expression = "FILE_NAME:\\s*(?P<file_path>\\S+)"
  }

  stage.regex {
    source = "rest"
    expression = "BYTES_TRANSFERRED:\\s*(?P<bytes_transferred>\\d+)"
  }

  stage.regex {
    source = "rest"
    expression = "AUTH_METHOD:\\s*(?P<auth_method>\\S+)"
  }

  // Promote extracted fields to labels for indexing
  stage.labels {
    values = {
      level            = "",
      action           = "",
      username         = "",
      remote_ip        = "",
      bytes_transferred = "",
    }
  }

  stage.timestamp {
    source = "timestamp"
    format = "2006-01-02T15:04:05.000Z"
  }

  // Store additional fields as structured metadata (searchable but not indexed)
  stage.structured_metadata {
    values = {
      file_path   = "",
      auth_method = "",
      thread      = "",
    }
  }

  stage.label_drop {
    values = ["rest"]
  }
}

loki.write "local_loki" {
  endpoint {
    url = "http://loki:3100/loki/api/v1/push"
  }
}
Grafana Datasource Configuration
File: /opt/observability/grafana/provisioning/datasources/datasources.yaml
This file tells Grafana how to connect to Loki. By placing it in the provisioning directory, the connection is configured automatically when Grafana starts - no manual setup required.
apiVersion: 1

datasources:
  - name: Loki
    type: loki
    uid: loki
    access: proxy
    url: http://loki:3100
    isDefault: true
    editable: false
    jsonData:
      maxLines: 1000
Grafana Dashboard Provider Configuration
File: /opt/observability/grafana/provisioning/dashboards/dashboards.yaml
This tells Grafana to automatically load dashboard JSON files from the specified directory. Any .json file placed in the json/ subdirectory will appear in Grafana's dashboard list.
apiVersion: 1

providers:
  - name: "SFTP Gateway Dashboards"
    orgId: 1
    folder: "SFTP Gateway"
    folderUid: "sftp-gateway"
    type: file
    disableDeletion: false
    editable: true
    options:
      path: /etc/grafana/provisioning/dashboards/json
Pre-built SFTP Gateway Dashboard
File: /opt/observability/grafana/provisioning/dashboards/json/sftp-overview.json
This dashboard provides immediate visibility into SFTP Gateway activity without requiring you to build queries from scratch. It includes panels for log volume, authentication success/failure, data transfer by user, and more.
{
  "uid": "sftp-overview",
  "title": "SFTP Gateway Overview",
  "tags": ["sftp", "audit", "security"],
  "timezone": "browser",
  "schemaVersion": 39,
  "version": 2,
  "refresh": "10s",
  "time": {
    "from": "now-1h",
    "to": "now"
  },
  "templating": {
    "list": [
      {
        "name": "username",
        "type": "query",
        "datasource": { "type": "loki", "uid": "loki" },
        "query": { "label": "username", "refId": "LokiVariableQueryEditor-VariableQuery", "stream": "{job=\"sftp-gateway\"}", "type": 1 },
        "refresh": 2,
        "includeAll": true,
        "multi": true,
        "current": { "selected": true, "text": ["All"], "value": ["$__all"] }
      },
      {
        "name": "action",
        "type": "query",
        "datasource": { "type": "loki", "uid": "loki" },
        "query": { "label": "action", "refId": "LokiVariableQueryEditor-VariableQuery", "stream": "{job=\"sftp-gateway\"}", "type": 1 },
        "refresh": 2,
        "includeAll": true,
        "multi": true,
        "current": { "selected": true, "text": ["All"], "value": ["$__all"] }
      },
      {
        "name": "search_file",
        "type": "textbox",
        "label": "File Search",
        "current": { "selected": false, "text": "", "value": "" }
      }
    ]
  },
  "panels": [
    {
      "id": 1,
      "title": "Log Volume",
      "type": "timeseries",
      "gridPos": { "h": 8, "w": 12, "x": 0, "y": 0 },
      "datasource": { "type": "loki", "uid": "loki" },
      "targets": [
        {
          "expr": "sum(count_over_time({job=\"sftp-gateway\", username=~\"$username\", action=~\"$action\"}[1m]))",
          "legendFormat": "Total Logs",
          "refId": "A"
        }
      ],
      "fieldConfig": {
        "defaults": {
          "color": { "mode": "palette-classic" },
          "unit": "short"
        }
      },
      "options": { "legend": { "displayMode": "list", "placement": "bottom" } }
    },
    {
      "id": 2,
      "title": "Actions Breakdown",
      "type": "piechart",
      "gridPos": { "h": 8, "w": 6, "x": 12, "y": 0 },
      "datasource": { "type": "loki", "uid": "loki" },
      "targets": [
        {
          "expr": "sum by (action) (count_over_time({job=\"sftp-gateway\", username=~\"$username\"}[$__range]))",
          "legendFormat": "{{action}}",
          "refId": "A"
        }
      ],
      "options": { "legend": { "displayMode": "table", "placement": "right", "values": ["value", "percent"] } }
    },
    {
      "id": 3,
      "title": "Auth Success vs Failure",
      "type": "stat",
      "gridPos": { "h": 4, "w": 6, "x": 18, "y": 0 },
      "datasource": { "type": "loki", "uid": "loki" },
      "targets": [
        {
          "expr": "sum(count_over_time({job=\"sftp-gateway\", action=\"AUTHENTICATION_COMPLETE\"}[$__range]))",
          "legendFormat": "Success",
          "refId": "A"
        },
        {
          "expr": "sum(count_over_time({job=\"sftp-gateway\", action=\"AUTHENTICATION_STARTED\"}[$__range])) - sum(count_over_time({job=\"sftp-gateway\", action=\"AUTHENTICATION_COMPLETE\"}[$__range]))",
          "legendFormat": "Failed",
          "refId": "B"
        }
      ],
      "options": { "colorMode": "value", "graphMode": "none", "reduceOptions": { "calcs": ["lastNotNull"] } }
    },
    {
      "id": 4,
      "title": "Incomplete Auth (Failed Logins)",
      "type": "stat",
      "gridPos": { "h": 4, "w": 6, "x": 18, "y": 4 },
      "datasource": { "type": "loki", "uid": "loki" },
      "targets": [
        {
          "expr": "sum(count_over_time({job=\"sftp-gateway\", action=\"AUTHENTICATION_STARTED\"}[$__range])) - sum(count_over_time({job=\"sftp-gateway\", action=\"AUTHENTICATION_COMPLETE\"}[$__range]))",
          "legendFormat": "Failed Logins",
          "refId": "A"
        }
      ],
      "fieldConfig": { "defaults": { "color": { "fixedColor": "red", "mode": "fixed" } } },
      "options": { "colorMode": "value", "graphMode": "area" }
    },
    {
      "id": 5,
      "title": "Data Transferred by User",
      "type": "barchart",
      "gridPos": { "h": 8, "w": 12, "x": 0, "y": 8 },
      "datasource": { "type": "loki", "uid": "loki" },
      "targets": [
        {
          "expr": "sum by (username) (sum_over_time({job=\"sftp-gateway\", action=~\"SFTP_FILE_UPLOAD_COMPLETE|SFTP_FILE_DOWNLOAD_COMPLETE\"} | unwrap bytes_transferred [$__range]))",
          "legendFormat": "{{username}}",
          "refId": "A"
        }
      ],
      "fieldConfig": { "defaults": { "unit": "bytes" } },
      "options": { "orientation": "horizontal" }
    },
    {
      "id": 6,
      "title": "IPs with Failed Auth",
      "type": "table",
      "gridPos": { "h": 8, "w": 6, "x": 12, "y": 8 },
      "datasource": { "type": "loki", "uid": "loki" },
      "targets": [
        {
          "expr": "topk(10, sum by (remote_ip) (count_over_time({job=\"sftp-gateway\", action=\"AUTHENTICATION_STARTED\"}[$__range])) - sum by (remote_ip) (count_over_time({job=\"sftp-gateway\", action=\"AUTHENTICATION_COMPLETE\"}[$__range])))",
          "legendFormat": "",
          "refId": "A"
        }
      ],
      "transformations": [
        { "id": "sortBy", "options": { "fields": {}, "sort": [{ "field": "Value", "desc": true }] } }
      ],
      "fieldConfig": { "overrides": [{ "matcher": { "id": "byName", "options": "remote_ip" }, "properties": [{ "id": "displayName", "value": "IP Address" }] }] }
    },
    {
      "id": 7,
      "title": "Top Users by Activity",
      "type": "table",
      "gridPos": { "h": 8, "w": 6, "x": 18, "y": 8 },
      "datasource": { "type": "loki", "uid": "loki" },
      "targets": [
        {
          "expr": "topk(10, sum by (username) (count_over_time({job=\"sftp-gateway\", username=~\"$username\", action=~\"SFTP_FILE_UPLOAD_COMPLETE|SFTP_FILE_DOWNLOAD_COMPLETE|SFTP_DIR\"}[$__range])))",
          "legendFormat": "",
          "refId": "A"
        }
      ]
    },
    {
      "id": 8,
      "title": "File Search Results",
      "type": "logs",
      "gridPos": { "h": 8, "w": 24, "x": 0, "y": 16 },
      "datasource": { "type": "loki", "uid": "loki" },
      "targets": [
        {
          "expr": "{job=\"sftp-gateway\", username=~\"$username\", action=~\"$action\"} |~ \"$search_file\"",
          "refId": "A"
        }
      ],
      "options": {
        "showTime": true,
        "showLabels": true,
        "showCommonLabels": false,
        "wrapLogMessage": true,
        "prettifyLogMessage": false,
        "enableLogDetails": true,
        "dedupStrategy": "none",
        "sortOrder": "Descending"
      }
    },
    {
      "id": 9,
      "title": "Failed Auth Over Time",
      "type": "timeseries",
      "gridPos": { "h": 6, "w": 12, "x": 0, "y": 24 },
      "datasource": { "type": "loki", "uid": "loki" },
      "targets": [
        {
          "expr": "sum by (username) (count_over_time({job=\"sftp-gateway\", action=\"AUTHENTICATION_STARTED\"}[5m])) - sum by (username) (count_over_time({job=\"sftp-gateway\", action=\"AUTHENTICATION_COMPLETE\"}[5m]))",
          "legendFormat": "{{username}}",
          "refId": "A"
        }
      ],
      "fieldConfig": { "defaults": { "color": { "mode": "palette-classic" } } }
    },
    {
      "id": 10,
      "title": "Upload/Download Activity",
      "type": "timeseries",
      "gridPos": { "h": 6, "w": 12, "x": 12, "y": 24 },
      "datasource": { "type": "loki", "uid": "loki" },
      "targets": [
        {
          "expr": "sum(count_over_time({job=\"sftp-gateway\", action=\"SFTP_FILE_DOWNLOAD_COMPLETE\", username=~\"$username\"}[1m]))",
          "legendFormat": "Downloads",
          "refId": "A"
        },
        {
          "expr": "sum(count_over_time({job=\"sftp-gateway\", action=\"SFTP_FILE_UPLOAD_COMPLETE\", username=~\"$username\"}[1m]))",
          "legendFormat": "Uploads",
          "refId": "B"
        }
      ]
    },
    {
      "id": 11,
      "title": "Session Activity",
      "type": "timeseries",
      "gridPos": { "h": 6, "w": 12, "x": 0, "y": 30 },
      "datasource": { "type": "loki", "uid": "loki" },
      "targets": [
        {
          "expr": "sum(count_over_time({job=\"sftp-gateway\", action=\"SFTP_SESSION_STARTED\"}[5m]))",
          "legendFormat": "Sessions Started",
          "refId": "A"
        },
        {
          "expr": "sum(count_over_time({job=\"sftp-gateway\", action=\"SFTP_SESSION_STOPPED\"}[5m]))",
          "legendFormat": "Sessions Stopped",
          "refId": "B"
        }
      ]
    },
    {
      "id": 12,
      "title": "Connections by IP",
      "type": "table",
      "gridPos": { "h": 6, "w": 12, "x": 12, "y": 30 },
      "datasource": { "type": "loki", "uid": "loki" },
      "targets": [
        {
          "expr": "topk(10, sum by (remote_ip) (count_over_time({job=\"sftp-gateway\", action=\"CONNECTED\"}[$__range])))",
          "legendFormat": "",
          "refId": "A"
        }
      ]
    }
  ]
}
Step 5: Start the Observability Stack
With all configuration files in place, you can now start the three containers. Docker Compose will pull the container images (this may take a few minutes on first run), create the network, and start the services in the correct order.
What you're doing: Starting Loki, Alloy, and Grafana as background services.
cd /opt/observability
sudo docker-compose up -d
Verify all containers are running:
sudo docker ps
You should see three containers with status "Up":
CONTAINER ID   IMAGE                    STATUS                    PORTS
xxxxxxxxxxxx   grafana/grafana:11.2.0   Up X minutes              127.0.0.1:3000->3000/tcp
xxxxxxxxxxxx   grafana/alloy:v1.4.2     Up X minutes              0.0.0.0:12345->12345/tcp
xxxxxxxxxxxx   grafana/loki:3.0.0       Up X minutes (healthy)    0.0.0.0:3100->3100/tcp
Note: Loki should show "(healthy)" - this indicates its health check is passing. Alloy and Grafana wait for Loki to be healthy before starting.
Step 6: Configure nginx as a Reverse Proxy
Grafana is currently only accessible from localhost (port 3000 is bound to 127.0.0.1). To access it from your browser, we need to configure the existing SFTP Gateway nginx server to proxy requests to Grafana.
What you're doing: Adding a location block to nginx that forwards requests for /grafana/ to the Grafana container.
Why this approach: Rather than exposing Grafana directly on a new port, we route it through nginx to:
- Use the existing HTTPS certificate (no additional certificate management)
- Keep Grafana behind the same firewall rules as the SFTP Gateway admin interface
- Provide a clean URL path (
/grafana/) alongside the existing admin UI
Edit the nginx configuration:
sudo vi /etc/nginx/conf.d/website.conf
Find the HTTPS server block (the one with listen *:443 ssl) and add the following location block inside it, before the location / { block:
# Grafana reverse proxy
location /grafana/ {
    proxy_pass http://127.0.0.1:3000;
    proxy_set_header Host $host;
    proxy_set_header X-Real-IP $remote_addr;
    proxy_set_header X-Forwarded-For $proxy_add_x_forwarded_for;
    proxy_set_header X-Forwarded-Proto $scheme;
    proxy_http_version 1.1;
    proxy_set_header Upgrade $http_upgrade;
    proxy_set_header Connection "upgrade";
    proxy_read_timeout 300;
}
Important: The proxy_pass URL must NOT have a trailing slash. Grafana needs to receive the /grafana/ path prefix to generate correct links.
Test the configuration and reload nginx:
sudo nginx -t
sudo systemctl reload nginx
Step 7: Configure Grafana's External URL
Grafana needs to know its external URL to generate correct links for dashboards, login redirects, and API responses. The docker-compose.yml file contains a placeholder that you need to replace with your server's actual IP address or hostname.
What you're doing: Updating Grafana's configuration to use your server's real address.
cd /opt/observability
sed -i 's/YOUR_SERVER_IP_OR_HOSTNAME/your-actual-ip-or-hostname/' docker-compose.yml
sudo docker-compose up -d
For example, if your server's public IP is 3.234.240.29:
sed -i 's/YOUR_SERVER_IP_OR_HOSTNAME/3.234.240.29/' docker-compose.yml
Or if you have a DNS name:
sed -i 's/YOUR_SERVER_IP_OR_HOSTNAME/sftp.example.com/' docker-compose.yml
Then restart Grafana to apply the change:
sudo docker-compose up -d
Accessing Grafana
Your observability stack is now complete. Access Grafana through your browser:
- Navigate to
https://<your-server-ip>/grafana/ - Accept the self-signed certificate warning (or configure a valid certificate)
- Log in with the default credentials:
admin/admin - Change the password immediately when prompted
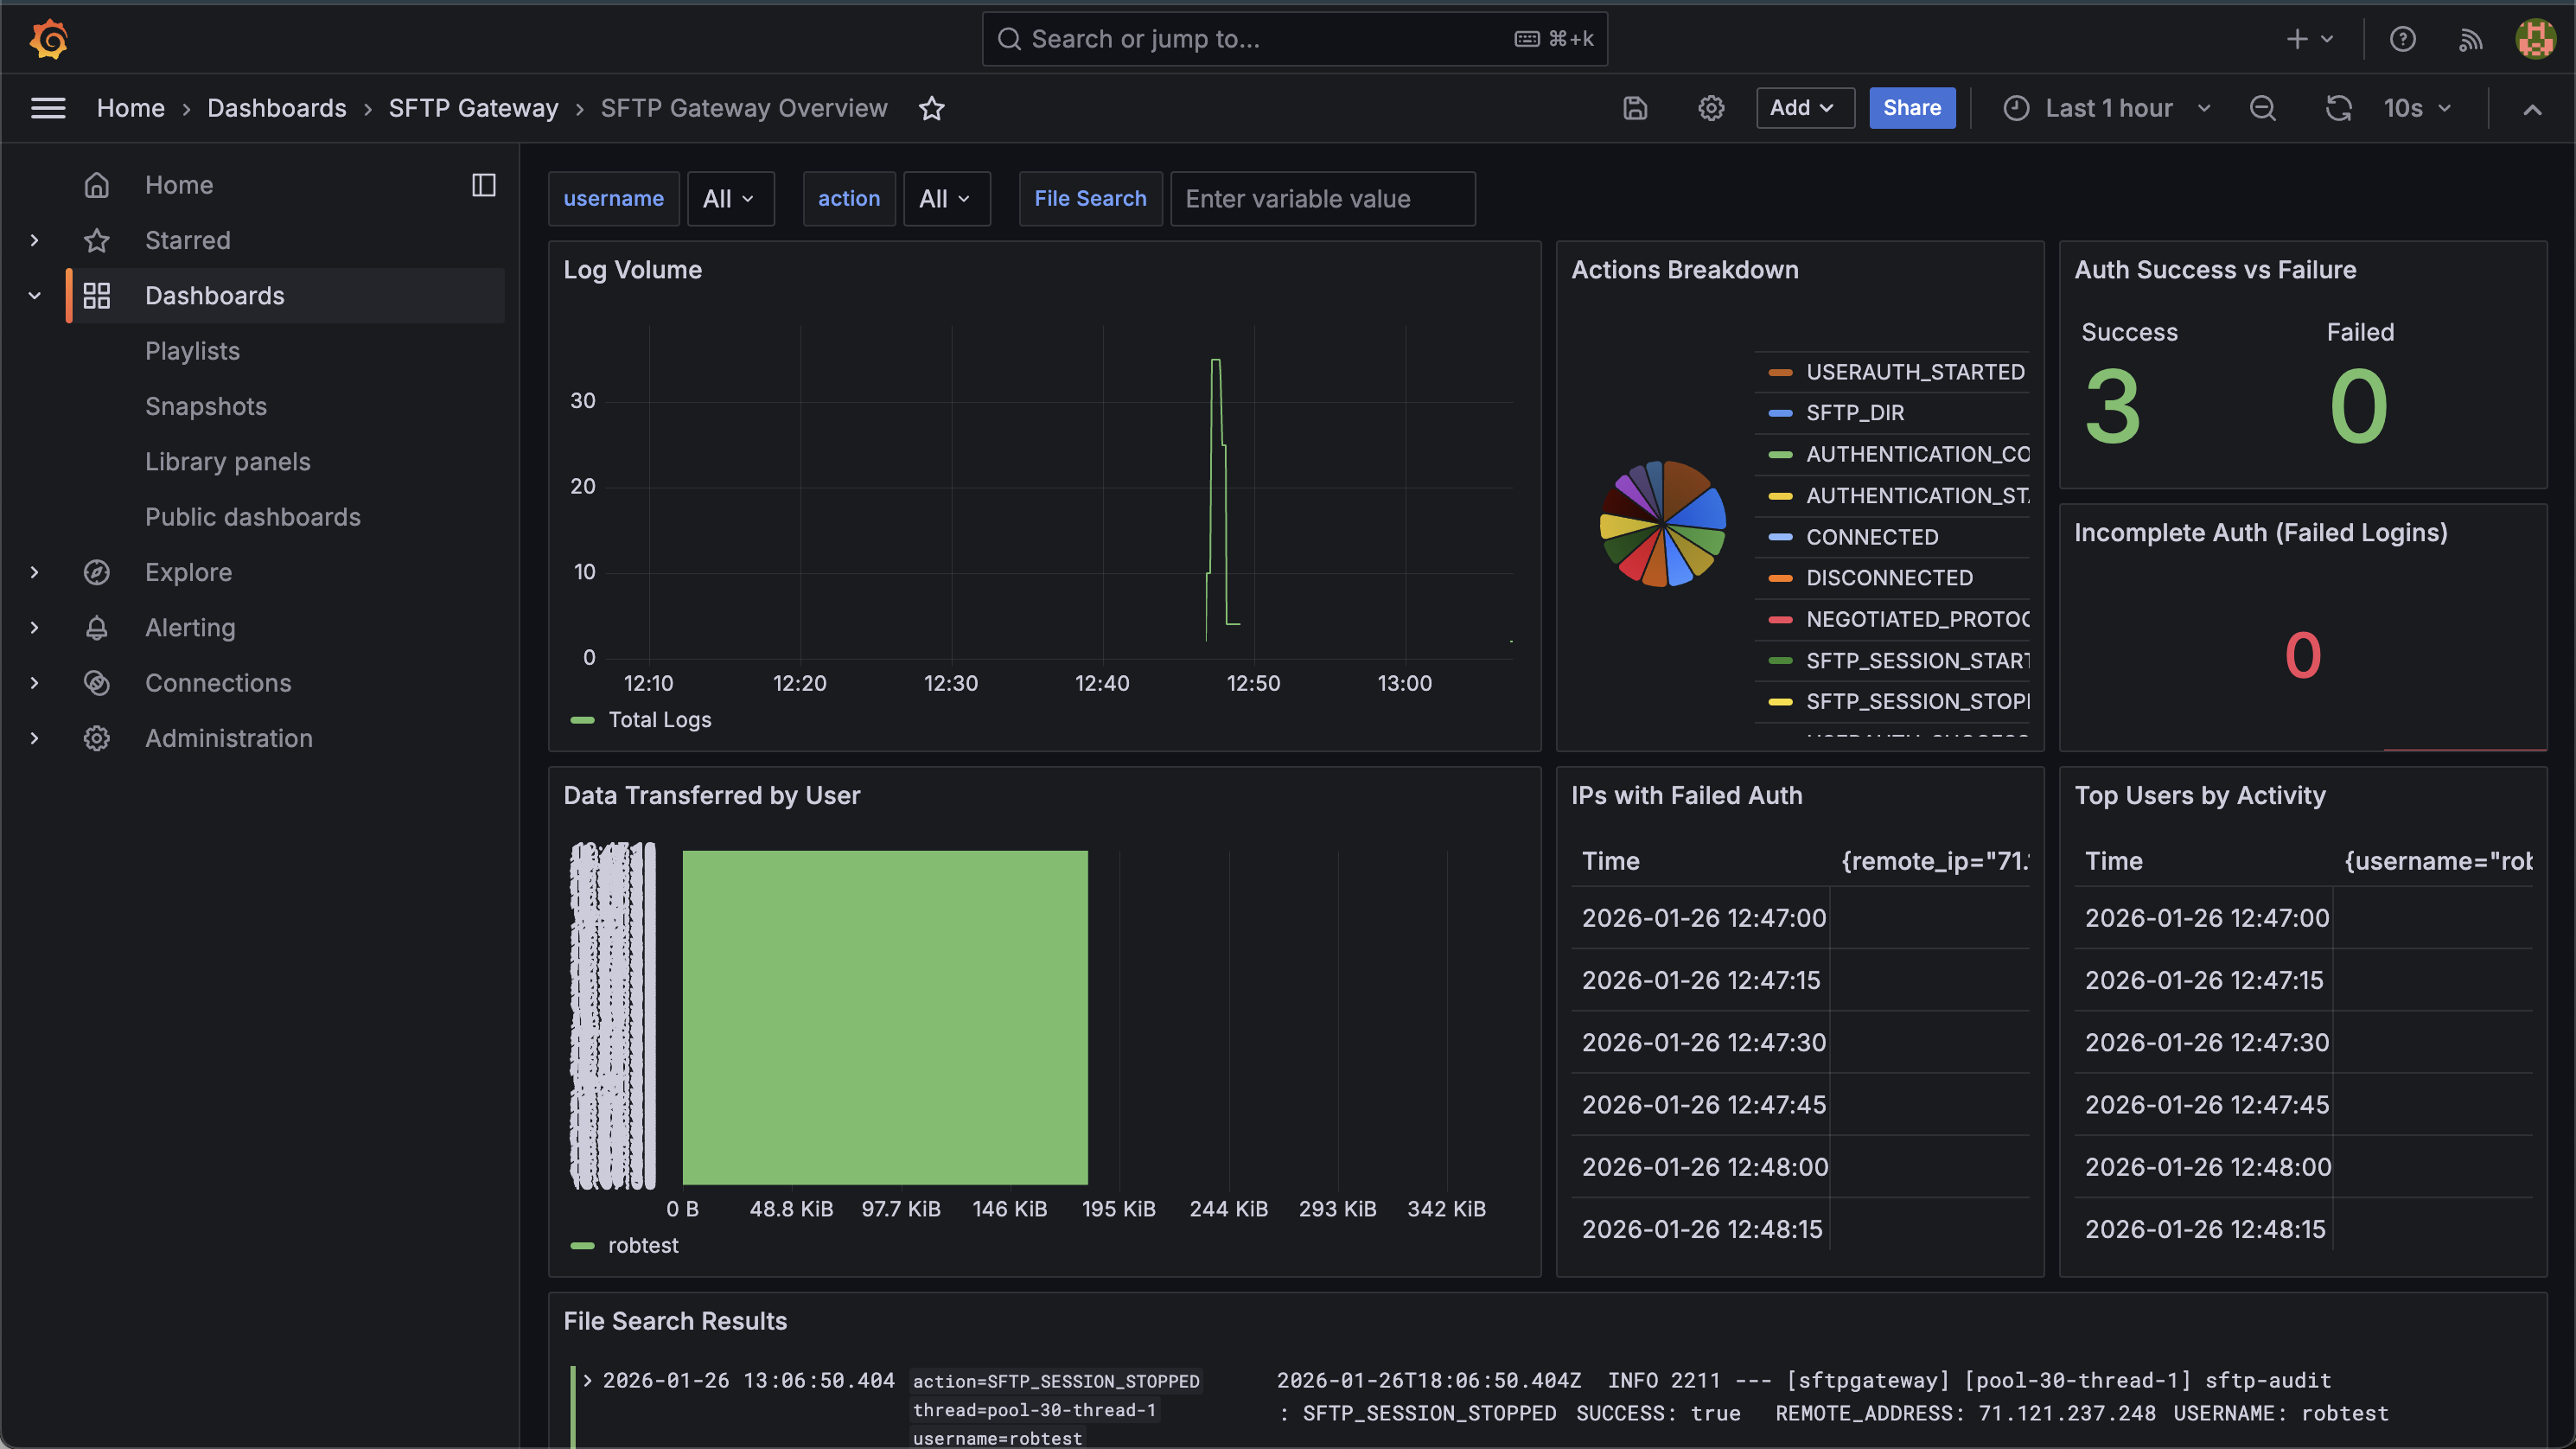
- Navigate to Dashboards → SFTP Gateway → SFTP Gateway Overview
Understanding the Dashboard
The SFTP Gateway Overview dashboard provides several panels for monitoring file transfer activity:
| Panel | What It Shows | Use Case |
|---|---|---|
| Log Volume | Total audit events over time | Identify busy periods, detect unusual activity spikes |
| Actions Breakdown | Pie chart of action types | Understand the mix of operations (uploads vs downloads vs directory listings) |
| Auth Success vs Failure | Count of successful and failed authentications | Security monitoring - watch for authentication attacks |
| Incomplete Auth (Failed Logins) | Failed login attempt count | Alert threshold indicator for brute force detection |
| Data Transferred by User | Bytes uploaded/downloaded per user | Identify heavy users, track data movement |
| IPs with Failed Auth | Top IPs with authentication failures | Identify potential attackers or misconfigured clients |
| Top Users by Activity | Most active users by operation count | Understand usage patterns |
| File Search Results | Searchable log entries | Find specific file transfers by filename |
| Failed Auth Over Time | Failed authentication trends | Spot attack patterns over time |
| Upload/Download Activity | File transfer trends over time | Monitor transfer volume patterns |
| Session Activity | Session starts/stops over time | Track concurrent usage |
| Connections by IP | Top connecting IP addresses | Identify primary client locations |
Using the Dashboard Filters
The dashboard includes three filters at the top:
- username - Filter all panels to show only specific users
- action - Filter to specific action types
- File Search - Text search across log content (use in the File Search Results panel)
Writing Custom Queries
Beyond the pre-built dashboard, you can write custom LogQL queries in Grafana's Explore view. LogQL is Loki's query language, similar to PromQL but designed for logs.
Common Query Examples
Search for a specific file by name:
{job="sftp-gateway"} |= "invoice.pdf"
Find all uploads by a specific user:
{job="sftp-gateway", action="SFTP_FILE_UPLOAD_COMPLETE", username="johndoe"}
Count failed login attempts in the last hour:
sum(count_over_time({job="sftp-gateway", action="AUTHENTICATION_STARTED"}[1h]))
- sum(count_over_time({job="sftp-gateway", action="AUTHENTICATION_COMPLETE"}[1h]))
Calculate total data transferred by user in the last 24 hours:
sum by (username) (sum_over_time({job="sftp-gateway", action=~"SFTP_FILE_UPLOAD_COMPLETE|SFTP_FILE_DOWNLOAD_COMPLETE"} | unwrap bytes_transferred [24h]))
View all activity from a specific IP address:
{job="sftp-gateway", remote_ip="192.168.1.100"}
Find large file transfers (over 100MB):
{job="sftp-gateway", action=~"SFTP_FILE_UPLOAD_COMPLETE|SFTP_FILE_DOWNLOAD_COMPLETE"} | bytes_transferred > 104857600
Understanding SFTP Gateway Log Actions
SFTP Gateway logs different actions throughout the lifecycle of a connection. Understanding these helps you write effective queries:
| Action | When It's Logged | Key Fields |
|---|---|---|
CONNECTION_ATTEMPT | Client initiates TCP connection | remote_ip |
CONNECTED | TCP connection established | remote_ip |
DISCONNECTED | Connection closed | remote_ip, username |
AUTHENTICATION_STARTED | Client begins authentication | remote_ip, username |
AUTHENTICATION_COMPLETE | Authentication succeeded | remote_ip, username, auth_method |
USERAUTH_STARTED | Specific auth method attempted | remote_ip, username, auth_method |
USERAUTH_SUCCESS | Specific auth method succeeded | remote_ip, username, auth_method |
SFTP_SESSION_STARTED | SFTP subsystem opened | remote_ip, username |
SFTP_SESSION_STOPPED | SFTP subsystem closed | remote_ip, username |
SFTP_DIR | Directory listing requested | remote_ip, username, file_path |
SFTP_FILE_UPLOAD_STARTED | Upload begins | remote_ip, username, file_path |
SFTP_FILE_UPLOAD_COMPLETE | Upload finishes | remote_ip, username, file_path, bytes_transferred |
SFTP_FILE_DOWNLOAD_STARTED | Download begins | remote_ip, username, file_path |
SFTP_FILE_DOWNLOAD_COMPLETE | Download finishes | remote_ip, username, file_path, bytes_transferred |
SFTP_SET_ATTRIBUTES | File attributes modified | remote_ip, username, file_path |
Detecting Failed Logins
SFTP Gateway does not log a specific "authentication failed" action. Instead, failed logins are detected by finding AUTHENTICATION_STARTED events that don't have a corresponding AUTHENTICATION_COMPLETE event.
The dashboard calculates this automatically:
(count of AUTHENTICATION_STARTED) - (count of AUTHENTICATION_COMPLETE) = failed attempts
This approach catches all failure modes: wrong password, invalid username, key rejection, and client disconnection during authentication.
Troubleshooting
Verifying Log Collection
Check if Alloy is successfully sending logs to Loki:
curl -s "http://localhost:3100/loki/api/v1/label/job/values"
Expected output:
{"status":"success","data":["sftp-gateway"]}
If "sftp-gateway" doesn't appear, Alloy isn't collecting logs. Check its logs:
sudo docker logs alloy
Checking Loki Health
Verify Loki is ready to accept queries:
curl -s "http://localhost:3100/ready"
Expected output: ready
Verifying Log File Access
Ensure Alloy can read the SFTP Gateway log files:
ls -la /opt/sftpgw/log/
Files should be readable. If not, check the Docker volume mount in docker-compose.yml.
Viewing Container Logs
Check individual container logs for errors:
sudo docker logs loki
sudo docker logs alloy
sudo docker logs grafana
Restarting the Stack
If you make configuration changes or need to restart:
cd /opt/observability
sudo docker-compose restart
To completely stop and start (useful for major config changes):
sudo docker-compose down
sudo docker-compose up -d
Security Considerations
The observability stack is configured with security in mind:
- Grafana binds to localhost only - Port 3000 is not exposed externally; all access goes through nginx
- HTTPS via nginx - Grafana is served over the existing SFTP Gateway HTTPS configuration
- No external log exposure - Loki and Alloy ports are internal to the Docker network
Recommended Security Hardening
Change the default Grafana password immediately after first login
Restrict access by IP - Update your EC2 security group to allow HTTPS (443) only from trusted IP ranges
Use a valid TLS certificate - Replace the self-signed certificate with one from Let's Encrypt or your organization's CA
Consider authentication integration - Grafana supports LDAP, OAuth, and SAML for enterprise authentication
Set up alerting - Configure Grafana alerts for security events like excessive failed logins
Maintenance
Storage Management
View current log storage usage:
sudo docker exec loki du -sh /loki
Logs are retained for 31 days by default. To change this, edit retention_period in /opt/observability/loki/loki-config.yaml and restart Loki.
Backing Up Dashboards
Your custom dashboards are stored in Grafana's database. To back up:
sudo docker cp grafana:/var/lib/grafana/grafana.db /opt/observability/grafana-backup.db
The provisioned dashboard (sftp-overview.json) is already in your config directory.
Updating the Stack
To update to newer versions of Loki, Alloy, or Grafana:
- Edit
docker-compose.ymland update the image tags - Pull the new images and restart:
cd /opt/observability
sudo docker-compose pull
sudo docker-compose up -d
Log Rotation
Loki handles its own data lifecycle based on the retention_period setting. The source SFTP Gateway logs in /opt/sftpgw/log/ are managed by SFTP Gateway's own log rotation configuration.