SFTP Gateway Log Observability Setup Guide (Docker Deployment)
TLDR
- Deploy SFTP Gateway with full observability stack using
docker compose up -d- Includes Grafana, Loki, and Alloy for log visualization and search
- Pre-built dashboard for monitoring uploads, failed logins, and user activity
- Ideal for local development, demos, and proof of concept deployments
Introduction
SFTP remains one of the most widely used protocols for secure file transfer, but traditional SFTP servers treat logging as an afterthought. Log files sit on disk in plain text, making it nearly impossible to answer basic questions like "Who uploaded that file last week?" or "Which IP addresses have been trying to brute-force our server?" Without proper tooling, these logs become write-only archives that nobody ever reads—until something goes wrong and you're left grep-ing through gigabytes of text.
This guide solves that problem by deploying SFTP Gateway alongside a modern log observability stack, all running in Docker containers. Unlike the single-instance guides that install the observability stack on an existing EC2 or VM, this deployment runs everything in containers—including SFTP Gateway itself. With a single docker compose up command, you get a fully functional SFTP server with real-time log visualization, powerful search capabilities, and pre-built security dashboards.
By the end of this guide, you'll have a complete file transfer and monitoring solution that lets you:
- Search for any file transferred through SFTP Gateway by filename, user, or IP address
- Monitor failed login attempts and identify potential security threats
- Track data transfer volumes by user to understand usage patterns
- Visualize activity trends over time with interactive dashboards
- Query logs programmatically using LogQL for custom reporting
This deployment is ideal for:
- Local development and testing - Run the full stack on your laptop
- Demo environments - Quickly spin up SFTP Gateway for evaluation
- Proof of concept deployments - Test observability before production rollout
Note: This deployment uses SFTP Gateway container images from Thorn Technologies hosted on Docker Hub.
Architecture Overview
The power of this deployment comes from combining two complementary stacks: SFTP Gateway handles secure file transfers while the Grafana observability stack (Loki, Alloy, and Grafana) transforms raw logs into actionable insights. These components communicate through a shared Docker network and a shared log volume, creating a seamless pipeline from file transfer events to visual dashboards.
The deployment consists of seven containers that work together:
| Component | Purpose | Port |
|---|---|---|
| db | PostgreSQL database for SFTP Gateway configuration | 5455 (internal) |
| backend | SFTP Gateway backend service (Spring Boot) | 22 (SFTP), 8080 (internal API) |
| ui | SFTP Gateway web admin interface | 443 (HTTPS) |
| Alloy | Watches SFTP Gateway log files, parses each line to extract structured fields, and forwards to Loki | 12345 (internal) |
| Loki | Stores logs in a compressed, indexed format optimized for fast querying | 3100 (internal) |
| Grafana | Provides the web interface for searching logs, building dashboards, and setting up alerts | 3000 (external) |
How Data Flows Through the Stack
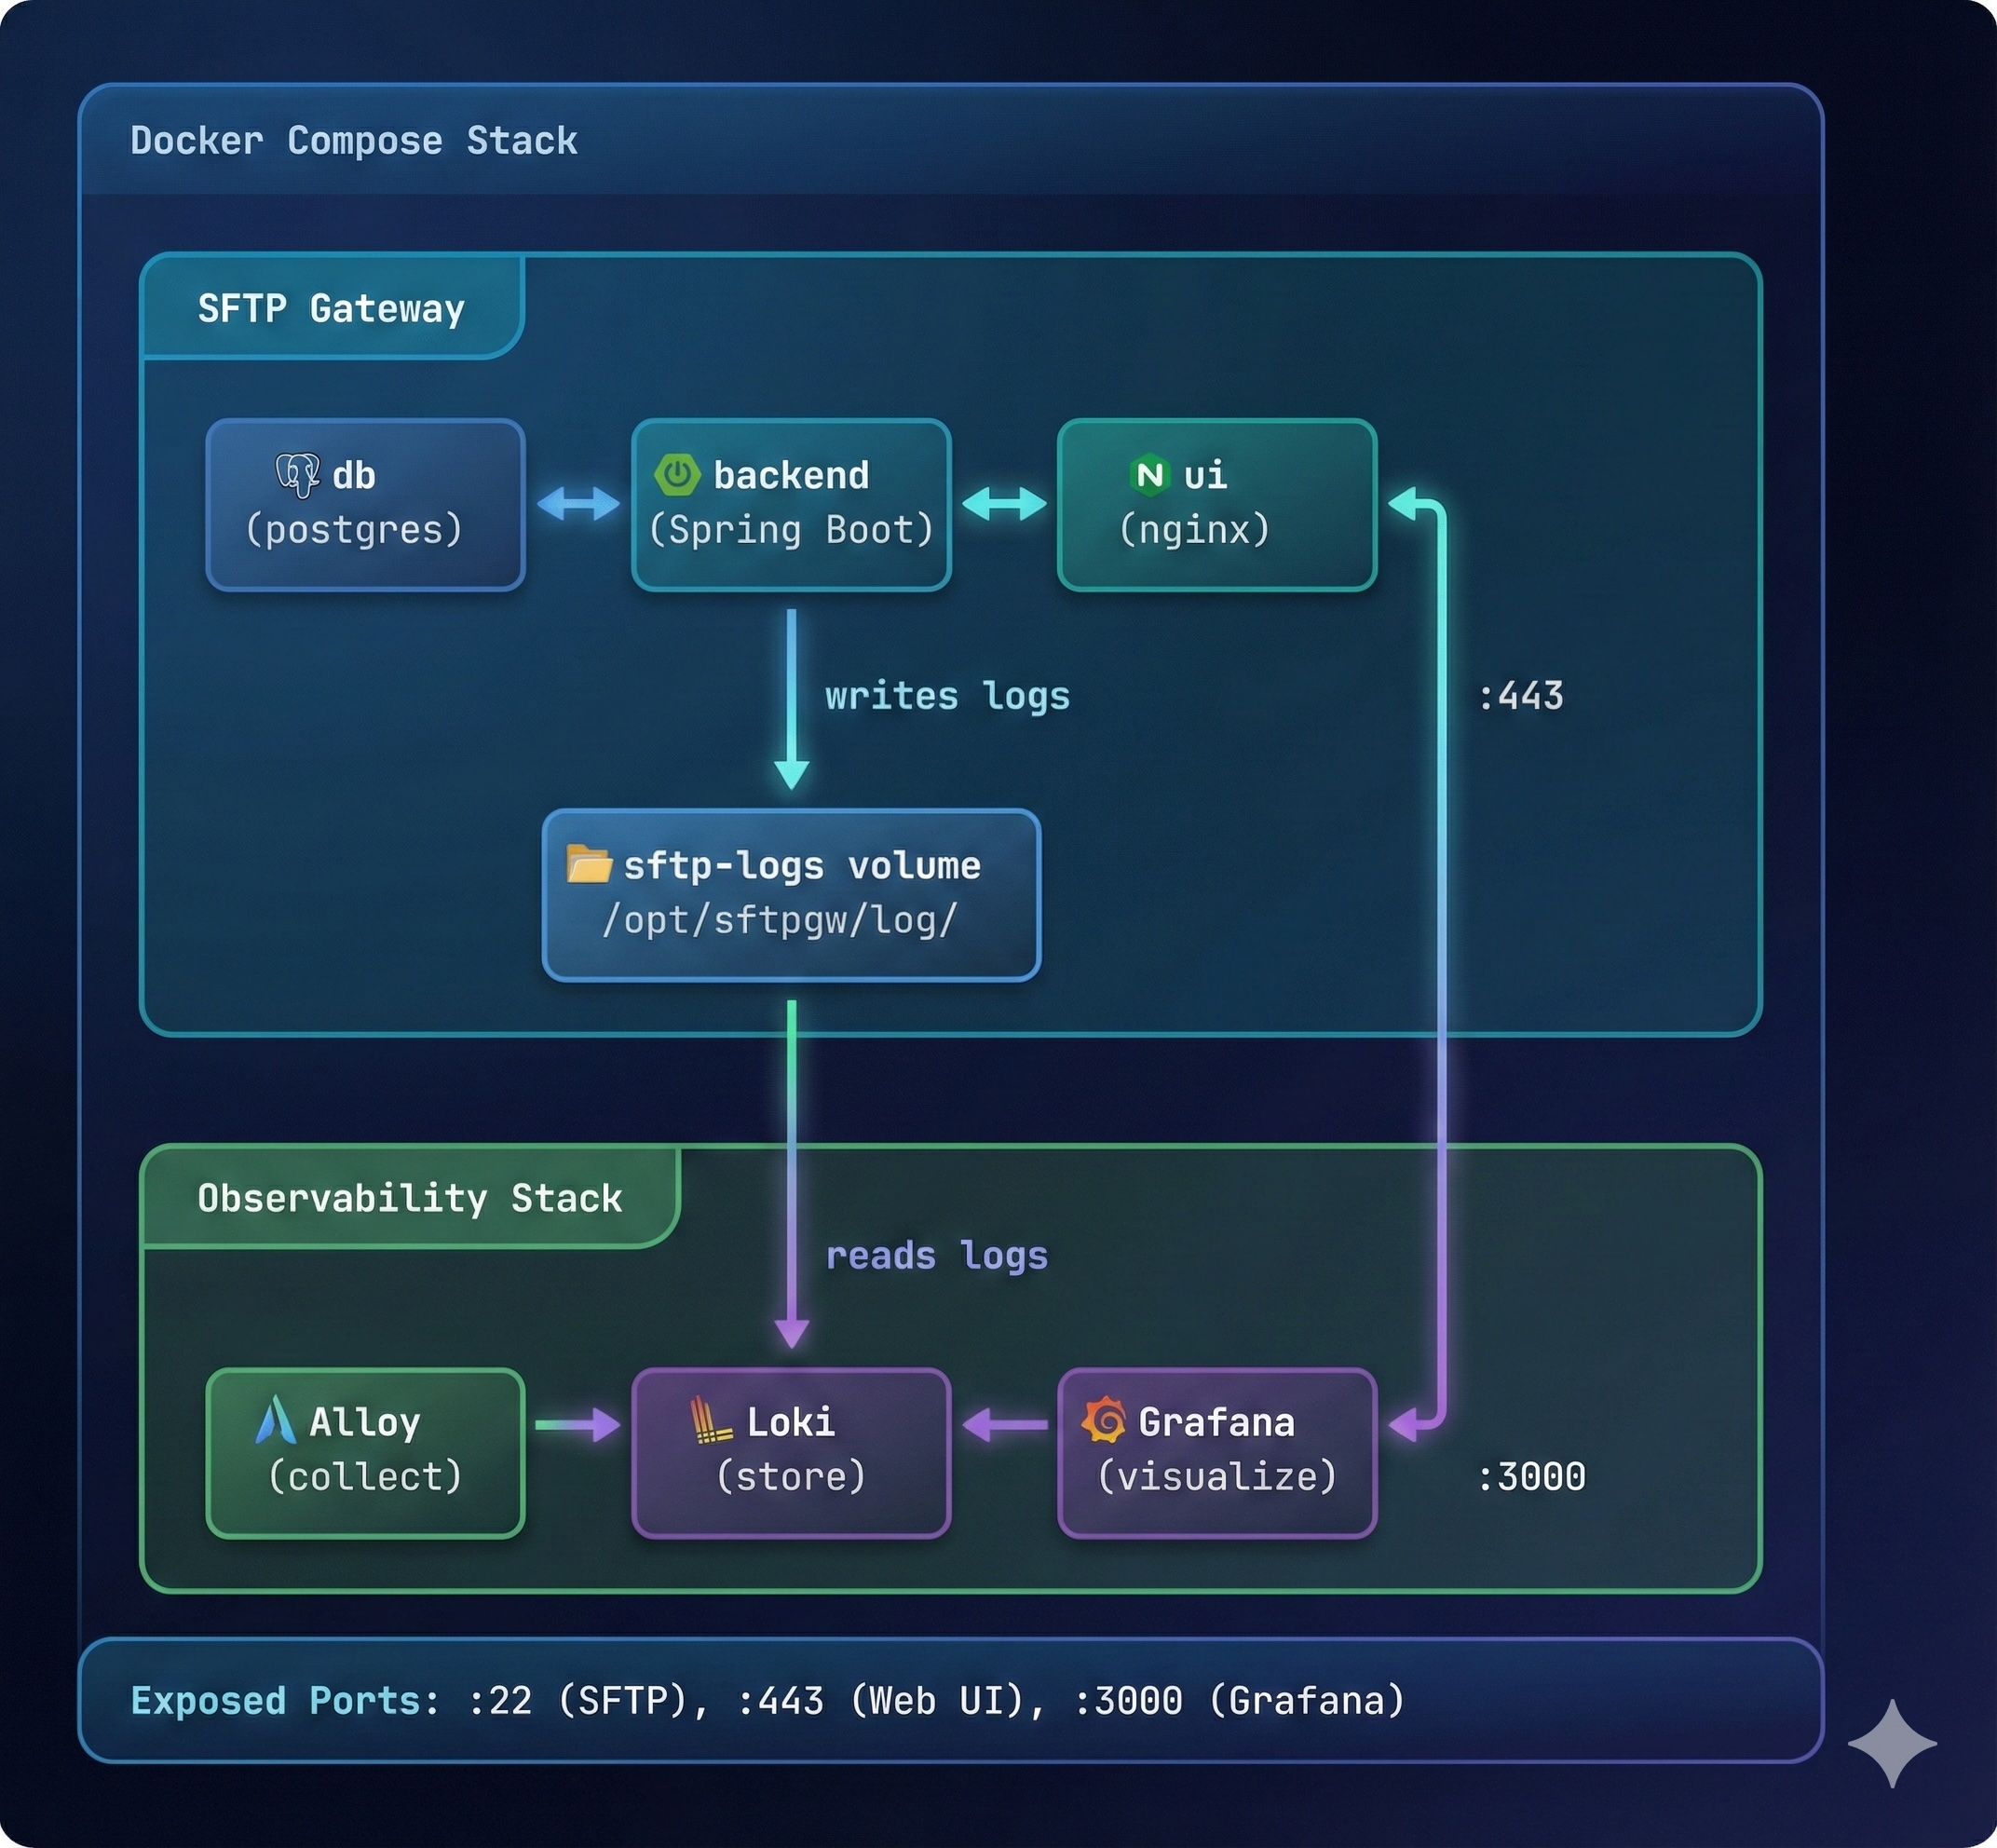
- SFTP Gateway backend writes audit logs to a shared Docker volume (
sftp-logs) - Alloy continuously monitors these log files, parsing each line to extract structured data like usernames, IP addresses, filenames, and bytes transferred
- Loki receives the parsed logs and stores them efficiently, indexing key fields for fast searching
- Grafana queries Loki to display logs in dashboards and respond to search queries
Prerequisites
Before starting, ensure you have:
- Docker Desktop installed (download here)
- At least 4GB of available RAM for Docker
- At least 5GB of free disk space
Note: The SFTP Gateway container images are hosted on Docker Hub and can be pulled without authentication.
Installation Steps
The installation process involves creating a directory structure, adding configuration files, and starting the Docker Compose stack. While there are several configuration files to create, each one serves a specific purpose and you only need to set this up once. After the initial setup, the entire stack can be started or stopped with a single command.
Step 1: Create the Directory Structure
Create a dedicated directory for the deployment with subdirectories for each component's configuration.
mkdir -p sftpgw-observability/{loki,alloy,grafana/provisioning/datasources,grafana/provisioning/dashboards/json}
cd sftpgw-observability
This creates:
loki/- Loki's configurationalloy/- Alloy's log parsing configurationgrafana/provisioning/- Grafana's auto-configuration for datasources and dashboards
Step 2: Create the Configuration Files
This is the most involved step, but also the most important. Each configuration file controls a different aspect of the system: how containers communicate, how logs are parsed and stored, and how dashboards display your data. The good news is that these configurations work out of the box—you can copy them exactly as shown and customize later if needed.
We'll create six files in total:
- docker-compose.yml - Defines all seven services and how they connect
- loki-config.yaml - Configures Loki's storage and retention settings
- config.alloy - Tells Alloy how to parse SFTP Gateway logs
- datasources.yaml - Connects Grafana to Loki automatically
- dashboards.yaml - Tells Grafana where to find dashboard definitions
- sftp-overview.json - The pre-built SFTP Gateway dashboard
Docker Compose Configuration
File: docker-compose.yml
This file defines all seven containers and how they interact. Key points:
- SFTP Gateway services (db, backend, ui) run in the same network as observability services
- The
sftp-logsvolume is shared between backend (writes) and Alloy (reads) - Health checks ensure services start in the correct order
- Grafana is exposed directly on port 3000 for easy access
# SFTP Gateway with Observability Stack
# Combined deployment: SFTP Gateway + Loki + Alloy + Grafana

services:
  # =============================================================================
  # SFTP Gateway Services
  # =============================================================================

  # PostgreSQL Database
  db:
    image: postgres:16-alpine
    container_name: sftpgw_db
    restart: unless-stopped
    ports:
      - "5455:5432"
    environment:
      - POSTGRES_DB=sftpgw
      - POSTGRES_USER=sftpgw
      - POSTGRES_PASSWORD=sftpgw
    volumes:
      - postgres-data:/var/lib/postgresql/data
    healthcheck:
      test: ["CMD-SHELL", "pg_isready -U sftpgw -d sftpgw"]
      interval: 5s
      timeout: 5s
      retries: 5
    networks:
      - sftpgw-observability

  # Permission initialization for file storage and logs
  permissions:
    image: busybox:latest
    container_name: sftpgw_permissions
    command: sh -c "chown -R 1000:1000 /mnt/sftpgw_1 && chmod -R 755 /mnt/sftpgw_1 && chown -R 1000:1000 /opt/sftpgw/log && chmod -R 755 /opt/sftpgw/log"
    volumes:
      - sftpgw-mount:/mnt/sftpgw_1
      - sftp-logs:/opt/sftpgw/log
    networks:
      - sftpgw-observability

  # SFTP Gateway Backend (Spring Boot)
  backend:
    image: thorntech/sftpgateway-backend:3.8.3
    container_name: sftpgw_backend
    restart: unless-stopped
    user: sftpgw
    working_dir: /opt/sftpgw
    ports:
      - "22:22"
      - "8080:8080"
    environment:
      # Application settings
      - SPRING_PROFILES_ACTIVE=local
      - LOGGING_LEVEL_ROOT=INFO
      # Database connection
      - SPRING_DATASOURCE_URL=jdbc:postgresql://db:5432/sftpgw
      - SPRING_DATASOURCE_USERNAME=sftpgw
      - SPRING_DATASOURCE_PASSWORD=sftpgw
      # Security settings (generated in Step 3)
      - SECURITY_CLIENT_ID=${SECURITY_CLIENT_ID}
      - SECURITY_CLIENT_SECRET=${SECURITY_CLIENT_SECRET}
      - SECURITY_JWT_SECRET=${SECURITY_JWT_SECRET}
      - SERVER_PORT=8080
      - HOME=/home/sftpgw
      # Default storage: Local File System
      - FEATURES_FIRST_CONNECTION_CLOUD_PROVIDER=lfs
      - FEATURES_FIRST_CONNECTION_NAME=Local File System
      - FEATURES_FIRST_CONNECTION_BASE_PREFIX=/mnt/sftpgw_1
    volumes:
      - sftpgw-home:/home/sftpgw
      - sftpgw-mount:/mnt/sftpgw_1
      - sftp-logs:/opt/sftpgw/log
    deploy:
      resources:
        limits:
          memory: 4G
        reservations:
          memory: 4G
    depends_on:
      db:
        condition: service_healthy
      permissions:
        condition: service_completed_successfully
    healthcheck:
      test: ["CMD-SHELL", "curl -f http://localhost:8080/actuator/health || exit 1"]
      interval: 30s
      timeout: 10s
      retries: 5
      start_period: 60s
    networks:
      - sftpgw-observability

  # SFTP Gateway Web UI
  ui:
    image: thorntech/sftpgateway-admin-ui:latest
    container_name: sftpgw_ui
    restart: unless-stopped
    ports:
      - "80:80"
      - "443:443"
    environment:
      BACKEND_URL: "http://backend:8080/"
      SECURITY_CLIENT_ID: "${SECURITY_CLIENT_ID}"
      SECURITY_CLIENT_SECRET: "${SECURITY_CLIENT_SECRET}"
      WEBSITE_KEY: "-----BEGIN PRIVATE KEY-----\nMIIEvAIBADANBgkqhkiG9w0BAQEFAASCBKYwggSiAgEAAoIBAQC2OzVSg3Zho9BS\n1GP5gY8r5ykIhdtmzcaueh0yCmsIx8Ve9Fvggcz79ndsDSOHuLzqkwwijlGzyij1\n19bzbtrtZTHFUDcMUdsRuM7A4/Vs192e/Nheqph4voarFWxYFXTsY+MYzDk3qHcI\nzS9iuMpTIlZ9dzO2I9aqj311UWYH3ErlZi6SGnc+UwIn+DYQekgaHYPo43spxiS5\nEvNJFdd1vW6btSTXExRGhAfhNEYo3Wdga1FGjmjRfMDj9GZOdL+bdDPbgX3fTtLA\n3ps8XrMlhfqSwDRZBD2IkQnZ+3qRdamWXq9rqm0teUYRcr3yn5GStL8eLwv6nAyq\nSPQj4OrdAgMBAAECggEAJUl2puhO1fo4o2YhgblUlAFj2EJZaw7iXyuN40IV9hE4\nTa5WyViN2qVq+KE0mq3+e8n0UvLHfW/5UxpjuWI+qhIJbcv0w5DRMC5eIcJTIr8F\nsiUe2bny4kvrzsBer6ROTRtAKcAJ2h1eo96mGj9g6MNPKrN0EYoCP9qF63YpGCTO\nzVpY7fIOxow2AHaiRlEblpRtJHMEL/DdcmxqvCvkREgjwQSWZKAL8Mu4dZKasYBy\n+nNV7vIudGmTciRuWJLgLayLXFil7OJME44PIktGlBNL3UgMM/oKCTM0qp8aA9DQ\n52dKWk9gI9I6mum+XnBMipQtBSFMyBHEoSb9dUytkQKBgQDonUUiz417NgO0fljE\n0GvrqNzk2RrJ50KMcLB6wdJoVx037qLJkHJJUeKsJeOqJfYOQ68PnusucEvSgR5N\n/69c1v5UfFASj+mVVtLaEsEEZ+MMSvYhSHq/Dlj4NdKaSkdcCxY8YoMN3fRNUTtY\no3oOQWDn+43uqe1Wabr2TMxUzQKBgQDIjT5jNo9H27bkiXUV2t+a9KmGTu2FNE9F\nCtMrSAmpj+lCHPNJzwgP49KfGf+KerkZ/bslixhROXo0HXQ0Eyp+iduNmXKjEX/h\nrpj+HekN/cdHyQA64Kc8qHYbN+4VgksXk1hWXovhY99bg2bEtzX9D4mFbmdArGXA\n4eMNZfJuUQKBgACfAuM/6KHOmB3wRG5qHA+qCMT3q3Gkk3Hqjx4UzGoI6YQPuBGP\nuC5n8JIDG+OFbG3HUn1ZMEmUdS9ftuQAbchyroUtO82A4t/KNo/sguVvHZUX0iZu\nmh1OfYBULHbLAfvF785DeRQdZpyaPe1TqmzFUevsqQldHMwhRiWIOPd1AoGAYy6P\nCwvhgj0jzxQ3xm4vJXgYGqcQCk9bYJ7A3mfK94OHbT3aB8eOiiU2dZ6q5TZaMoNs\nOV330bumNv3WCSbtXhUZcobPzduKrfbmDM6IAnZeRp8eMQAHVRVPC5j2csa0El25\nU0WA0h/NR3nNqj2dQqCbd1SpVa+sxt4vpuGjKnECgYASiNxDdbApD6F153Y56dO1\nPM17ujQ+sa0qZH+fdCKweBZ5xHN+I7VYf4zMJ630/7KWy9lwa4N8GWxNNGAEhWav\n7xqWNw2UCfb5BzsztIxSL60NSnqCzqvZP7OSboFS9X6lQKQ73bWyAtQuhG5ydALz\n0Bz/2SdeU40IbTl/wrpY2g==\n-----END PRIVATE KEY-----\n"
      WEBSITE_BUNDLE_CRT: "-----BEGIN CERTIFICATE-----\nMIID4zCCAsugAwIBAgIUd2Q6F9G4dGxIqLd8cS6ltLeDpk4wDQYJKoZIhvcNAQEL\nBQAwZDELMAkGA1UEBhMCVVMxEzARBgNVBAgMCkNhbGlmb3JuaWExFjAUBgNVBAcM\nDVNhbiBGcmFuY2lzY28xFDASBgNVBAoMC0RldmVsb3BtZW50MRIwEAYDVQQDDAls\nb2NhbGhvc3QwHhcNMjQxMTE3MDMwMzE4WhcNMjUxMTE3MDMwMzE4WjBkMQswCQYD\nVQQGEwJVUzETMBEGA1UECAwKQ2FsaWZvcm5pYTEWMBQGA1UEBwwNU2FuIEZyYW5j\naXNjbzEUMBIGA1UECgwLRGV2ZWxvcG1lbnQxEjAQBgNVBAMMCWxvY2FsaG9zdDCC\nASIwDQYJKoZIhvcNAQEBBQADggEPADCCAQoCggEBALY7NVKDdmGj0FLUY/mBjyvn\nKQiF22bNxq56HTIKawjHxV70W+CBzPv2d2wNI4e4vOqTDCKOUbPKKPXX1vNu2u1l\nMcVQNwxR2xG4zsDj9WzX3Z782F6qmHi+hqsVbFgVdOxj4xjMOTeodwjNL2K4ylMi\nVn13M7Yj1qqPfXVRZgfcSuVmLpIadz5TAif4NhB6SBodg+jjeynGJLkS80kV13W9\nbpu1JNcTFEaEB+E0RijdZ2BrUUaOaNF8wOP0Zk50v5t0M9uBfd9O0sDemzxesyWF\n+pLANFkEPYiRCdn7epF1qZZer2uqbS15RhFyvfKfkZK0vx4vC/qcDKpI9CPg6t0C\nAwEAAaOBjDCBiTAdBgNVHQ4EFgQUc31/aqt6ZE22MrD4JmpNZP8UNZswHwYDVR0j\nBBgwFoAUc31/aqt6ZE22MrD4JmpNZP8UNZswDwYDVR0TAQH/BAUwAwEB/zAUBgNV\nHREEDTALgglsb2NhbGhvc3QwCwYDVR0PBAQDAgeAMBMGA1UdJQQMMAoGCCsGAQUF\nBwMBMA0GCSqGSIb3DQEBCwUAA4IBAQAGtPbCCjw3ckDncp3UD32X9dfDLWZnvXRi\njsZ0kpLu3O1A+AJb7HGdeV7TB13DU6DvlHfPMExI8LPaybiLbAB5yO3pIYueoacc\ny6QK3s8AbtubWMROOeICBe6WVh63nzoPk3LjgyDk16Nm84VQequIGGJ3PlXZzXjZ\nPVlEEPryg8s6U8iY7z/HHXse4CytMrEB9last5Z3TBgNqTT5Uiqw9zAhb4L6oHwW\nzE99hgVx5G5eAVeziPY5Hy1xYY7/G6EXmdpRWI5BbJO4kKN0RFS03b8iGkgiwHvp\n24Yi6PfMCT1WSNQ9OEIjsAaQIKJikH1xww46y0oEn/wc2BBCgcOO\n-----END CERTIFICATE-----\n"
    depends_on:
      backend:
        condition: service_healthy
    networks:
      - sftpgw-observability

  # =============================================================================
  # Observability Stack
  # =============================================================================

  # Loki - Log aggregation and storage
  loki:
    image: grafana/loki:3.0.0
    container_name: loki
    restart: unless-stopped
    ports:
      - "3100:3100"
    volumes:
      - ./loki/loki-config.yaml:/etc/loki/local-config.yaml:ro
      - loki-data:/loki
    command: -config.file=/etc/loki/local-config.yaml
    healthcheck:
      test: ["CMD-SHELL", "wget --no-verbose --tries=1 --spider http://localhost:3100/ready || exit 1"]
      interval: 10s
      timeout: 5s
      retries: 5
    networks:
      - sftpgw-observability

  # Alloy - Log collection agent
  alloy:
    image: grafana/alloy:v1.4.2
    container_name: alloy
    restart: unless-stopped
    ports:
      - "12345:12345"
    volumes:
      - ./alloy/config.alloy:/etc/alloy/config.alloy:ro
      - sftp-logs:/var/log/sftp-gateway:ro
    command:
      - run
      - /etc/alloy/config.alloy
      - --server.http.listen-addr=0.0.0.0:12345
    depends_on:
      loki:
        condition: service_healthy
      backend:
        condition: service_healthy
    networks:
      - sftpgw-observability

  # Grafana - Visualization and dashboards
  grafana:
    image: grafana/grafana:11.2.0
    container_name: grafana
    restart: unless-stopped
    ports:
      - "3000:3000"
    environment:
      - GF_SECURITY_ADMIN_USER=admin
      - GF_SECURITY_ADMIN_PASSWORD=admin
      - GF_USERS_ALLOW_SIGN_UP=false
      - GF_SERVER_ROOT_URL=http://localhost:3000/
    volumes:
      - ./grafana/provisioning:/etc/grafana/provisioning:ro
      - grafana-data:/var/lib/grafana
    depends_on:
      loki:
        condition: service_healthy
    networks:
      - sftpgw-observability

# =============================================================================
# Volumes
# =============================================================================
volumes:
  # SFTP Gateway volumes
  postgres-data:
  sftpgw-home:
  sftpgw-mount:
  sftp-logs:
  # Observability volumes
  loki-data:
  grafana-data:

# =============================================================================
# Networks
# =============================================================================
networks:
  sftpgw-observability:
    driver: bridge
Loki Configuration
File: loki/loki-config.yaml
Loki is configured for single-instance deployment with filesystem storage. Key settings:
- retention_period: 744h - Logs are kept for 31 days before automatic deletion
- ingestion_rate_mb: 16 - Allows bursts of log data during high activity
- embedded_cache - Speeds up repeated queries
# Loki Configuration for SFTP Gateway Docker Deployment

auth_enabled: false

server:
  http_listen_port: 3100
  grpc_listen_port: 9096
  log_level: info

common:
  instance_addr: 127.0.0.1
  path_prefix: /loki
  storage:
    filesystem:
      chunks_directory: /loki/chunks
      rules_directory: /loki/rules
  replication_factor: 1
  ring:
    kvstore:
      store: inmemory

query_range:
  results_cache:
    cache:
      embedded_cache:
        enabled: true
        max_size_mb: 100

schema_config:
  configs:
    - from: 2024-01-01
      store: tsdb
      object_store: filesystem
      schema: v13
      index:
        prefix: index_
        period: 24h

storage_config:
  tsdb_shipper:
    active_index_directory: /loki/tsdb-index
    cache_location: /loki/tsdb-cache

limits_config:
  retention_period: 744h  # 31 days
  reject_old_samples: true
  reject_old_samples_max_age: 168h
  ingestion_rate_mb: 16
  ingestion_burst_size_mb: 32
  max_query_series: 5000
  max_query_parallelism: 32

ruler:
  alertmanager_url: http://localhost:9093
  storage:
    type: local
    local:
      directory: /loki/rules
  rule_path: /loki/rules-temp
  ring:
    kvstore:
      store: inmemory

analytics:
  reporting_enabled: false
Alloy Log Parsing Configuration
File: alloy/config.alloy
This is the most important configuration file. Alloy watches the SFTP Gateway log files and uses regex patterns to extract structured fields from each log line.
What gets extracted:
action- The type of event (e.g., SFTP_FILE_UPLOAD_COMPLETE, AUTHENTICATION_STARTED)username- The SFTP user performing the actionremote_ip- The client's IP addressfile_path- The file being transferredbytes_transferred- Size of the transfer in bytesauth_method- How the user authenticated (password, key, etc.)
These extracted fields become searchable labels in Loki, enabling queries like "show me all uploads by user X from IP Y".
// Alloy Configuration for SFTP Gateway Log Collection
// Parses SFTP Gateway Spring Boot audit logs

// Local file source - reads SFTP audit logs from shared volume
local.file_match "sftp_logs" {
  path_targets = [{
    __path__ = "/var/log/sftp-gateway/*.log",
    job      = "sftp-gateway",
    env      = "docker",
  }]
}

// Loki source - tails matched files
loki.source.file "sftp_audit" {
  targets    = local.file_match.sftp_logs.targets
  forward_to = [loki.process.sftp_parser.receiver]
}

// Process and parse SFTP Gateway audit logs (Spring Boot format)
loki.process "sftp_parser" {
  forward_to = [loki.write.local_loki.receiver]

  // Only process sftp-audit lines (skip other Spring Boot logs)
  stage.match {
    selector = "{job=\"sftp-gateway\"}"
    pipeline_name = "sftp-audit-filter"

    stage.regex {
      expression = "^(?P<timestamp>\\S+)\\s+(?P<level>\\w+)\\s+\\d+\\s+---\\s+\\[\\w+\\]\\s+\\[(?P<thread>[^\\]]+)\\]\\s+sftp-audit\\s+:\\s+(?P<action>\\S+)(?P<rest>.*)$"
    }

    // Drop non-matching lines (non sftp-audit logs)
    stage.drop {
      expression = "^$"
      source = "action"
      drop_counter_reason = "not_sftp_audit"
    }
  }

  // Extract REMOTE_ADDRESS or REMOTE_IP
  stage.regex {
    source = "rest"
    expression = "REMOTE_(?:ADDRESS|IP):\\s*(?P<remote_ip>[\\d\\.]+)"
  }

  // Extract USERNAME
  stage.regex {
    source = "rest"
    expression = "USERNAME:\\s*(?P<username>\\S+)"
  }

  // Extract FILE_NAME
  stage.regex {
    source = "rest"
    expression = "FILE_NAME:\\s*(?P<file_path>\\S+)"
  }

  // Extract BYTES_TRANSFERRED
  stage.regex {
    source = "rest"
    expression = "BYTES_TRANSFERRED:\\s*(?P<bytes_transferred>\\d+)"
  }

  // Extract AUTH_METHOD
  stage.regex {
    source = "rest"
    expression = "AUTH_METHOD:\\s*(?P<auth_method>\\S+)"
  }

  // Set labels for efficient querying
  stage.labels {
    values = {
      level       = "",
      action      = "",
      username    = "",
      remote_ip   = "",
    }
  }

  // Set timestamp from log
  stage.timestamp {
    source = "timestamp"
    format = "2006-01-02T15:04:05.000Z"
  }

  // Add structured metadata for detailed fields
  stage.structured_metadata {
    values = {
      file_path         = "",
      bytes_transferred = "",
      auth_method       = "",
      thread            = "",
    }
  }

  // Clean up - remove intermediate fields from log line
  stage.label_drop {
    values = ["rest"]
  }
}

// Send to Loki
loki.write "local_loki" {
  endpoint {
    url = "http://loki:3100/loki/api/v1/push"
  }
}
Grafana Datasource Configuration
File: grafana/provisioning/datasources/datasources.yaml
This file automatically connects Grafana to Loki when the container starts, so you don't need to configure the datasource manually.
apiVersion: 1

datasources:
  - name: Loki
    type: loki
    access: proxy
    url: http://loki:3100
    isDefault: true
    editable: false
    uid: loki
    jsonData:
      maxLines: 1000
Grafana Dashboard Provider Configuration
File: grafana/provisioning/dashboards/dashboards.yaml
This tells Grafana where to find the pre-built dashboard JSON file.
apiVersion: 1

providers:
  - name: "SFTP Gateway Dashboards"
    orgId: 1
    folder: "SFTP Gateway"
    folderUid: "sftp-gateway"
    type: file
    disableDeletion: false
    editable: true
    options:
      path: /etc/grafana/provisioning/dashboards/json
Pre-built SFTP Gateway Dashboard
File: grafana/provisioning/dashboards/json/sftp-overview.json
This dashboard provides 12 panels for monitoring SFTP Gateway activity. Create the file with the following content:
{
  "uid": "sftp-overview",
  "title": "SFTP Gateway Overview",
  "tags": [
    "sftp",
    "audit",
    "security"
  ],
  "timezone": "browser",
  "schemaVersion": 39,
  "version": 2,
  "refresh": "10s",
  "time": {
    "from": "now-1h",
    "to": "now"
  },
  "templating": {
    "list": [
      {
        "name": "username",
        "type": "query",
        "datasource": {
          "type": "loki",
          "uid": "loki"
        },
        "query": {
          "label": "username",
          "refId": "LokiVariableQueryEditor-VariableQuery",
          "stream": "{job=\"sftp-gateway\"}",
          "type": 1
        },
        "refresh": 2,
        "includeAll": true,
        "multi": true,
        "current": {
          "selected": true,
          "text": [
            "All"
          ],
          "value": [
            "$__all"
          ]
        }
      },
      {
        "name": "action",
        "type": "query",
        "datasource": {
          "type": "loki",
          "uid": "loki"
        },
        "query": {
          "label": "action",
          "refId": "LokiVariableQueryEditor-VariableQuery",
          "stream": "{job=\"sftp-gateway\"}",
          "type": 1
        },
        "refresh": 2,
        "includeAll": true,
        "multi": true,
        "current": {
          "selected": true,
          "text": [
            "All"
          ],
          "value": [
            "$__all"
          ]
        }
      },
      {
        "name": "search_file",
        "type": "textbox",
        "label": "File Search",
        "current": {
          "selected": false,
          "text": "",
          "value": ""
        }
      }
    ]
  },
  "panels": [
    {
      "id": 1,
      "title": "Log Volume",
      "type": "timeseries",
      "gridPos": {
        "h": 8,
        "w": 12,
        "x": 0,
        "y": 0
      },
      "datasource": {
        "type": "loki",
        "uid": "loki"
      },
      "targets": [
        {
          "expr": "sum(count_over_time({job=\"sftp-gateway\", username=~\"$username\", action=~\"$action\"}[1m]))",
          "legendFormat": "Total Logs",
          "refId": "A"
        }
      ],
      "fieldConfig": {
        "defaults": {
          "color": {
            "mode": "palette-classic"
          },
          "unit": "short"
        }
      },
      "options": {
        "legend": {
          "displayMode": "list",
          "placement": "bottom"
        }
      }
    },
    {
      "id": 2,
      "title": "Actions Breakdown",
      "type": "piechart",
      "gridPos": {
        "h": 8,
        "w": 6,
        "x": 12,
        "y": 0
      },
      "datasource": {
        "type": "loki",
        "uid": "loki"
      },
      "targets": [
        {
          "expr": "sum by (action) (count_over_time({job=\"sftp-gateway\", username=~\"$username\"}[$__range]))",
          "legendFormat": "{{action}}",
          "refId": "A"
        }
      ],
      "options": {
        "legend": {
          "displayMode": "table",
          "placement": "right",
          "values": [
            "value",
            "percent"
          ]
        }
      }
    },
    {
      "id": 3,
      "title": "Auth Success vs Failure",
      "type": "stat",
      "gridPos": {
        "h": 4,
        "w": 6,
        "x": 18,
        "y": 0
      },
      "datasource": {
        "type": "loki",
        "uid": "loki"
      },
      "targets": [
        {
          "expr": "sum(count_over_time({job=\"sftp-gateway\", action=\"AUTHENTICATION_COMPLETE\"}[$__range]))",
          "legendFormat": "Success",
          "refId": "A"
        },
        {
          "expr": "sum(count_over_time({job=\"sftp-gateway\", action=\"AUTHENTICATION_STARTED\"}[$__range])) - sum(count_over_time({job=\"sftp-gateway\", action=\"AUTHENTICATION_COMPLETE\"}[$__range]))",
          "legendFormat": "Failed",
          "refId": "B"
        }
      ],
      "options": {
        "colorMode": "value",
        "graphMode": "none",
        "reduceOptions": {
          "calcs": [
            "lastNotNull"
          ]
        }
      }
    },
    {
      "id": 4,
      "title": "Incomplete Auth (Failed Logins)",
      "type": "stat",
      "gridPos": {
        "h": 4,
        "w": 6,
        "x": 18,
        "y": 4
      },
      "datasource": {
        "type": "loki",
        "uid": "loki"
      },
      "targets": [
        {
          "expr": "sum(count_over_time({job=\"sftp-gateway\", action=\"AUTHENTICATION_STARTED\"}[$__range])) - sum(count_over_time({job=\"sftp-gateway\", action=\"AUTHENTICATION_COMPLETE\"}[$__range]))",
          "legendFormat": "Failed Logins",
          "refId": "A"
        }
      ],
      "fieldConfig": {
        "defaults": {
          "color": {
            "fixedColor": "red",
            "mode": "fixed"
          }
        }
      },
      "options": {
        "colorMode": "value",
        "graphMode": "area"
      }
    },
    {
      "id": 5,
      "title": "Data Transferred by User",
      "type": "barchart",
      "gridPos": {
        "h": 8,
        "w": 12,
        "x": 0,
        "y": 8
      },
      "datasource": {
        "type": "loki",
        "uid": "loki"
      },
      "targets": [
        {
          "expr": "sum by (username) (sum_over_time({job=\"sftp-gateway\", action=~\"SFTP_FILE_UPLOAD_COMPLETE|SFTP_FILE_DOWNLOAD_COMPLETE\"} | unwrap bytes_transferred [$__range]))",
          "legendFormat": "{{username}}",
          "refId": "A"
        }
      ],
      "fieldConfig": {
        "defaults": {
          "unit": "bytes"
        }
      },
      "options": {
        "orientation": "horizontal"
      }
    },
    {
      "id": 6,
      "title": "IPs with Failed Auth",
      "type": "table",
      "gridPos": {
        "h": 8,
        "w": 6,
        "x": 12,
        "y": 8
      },
      "datasource": {
        "type": "loki",
        "uid": "loki"
      },
      "targets": [
        {
          "expr": "topk(10, sum by (remote_ip) (count_over_time({job=\"sftp-gateway\", action=\"AUTHENTICATION_STARTED\"}[$__range])) - sum by (remote_ip) (count_over_time({job=\"sftp-gateway\", action=\"AUTHENTICATION_COMPLETE\"}[$__range])))",
          "legendFormat": "",
          "refId": "A"
        }
      ],
      "transformations": [
        {
          "id": "sortBy",
          "options": {
            "fields": {},
            "sort": [
              {
                "field": "Value",
                "desc": true
              }
            ]
          }
        }
      ],
      "fieldConfig": {
        "overrides": [
          {
            "matcher": {
              "id": "byName",
              "options": "remote_ip"
            },
            "properties": [
              {
                "id": "displayName",
                "value": "IP Address"
              }
            ]
          }
        ]
      }
    },
    {
      "id": 7,
      "title": "Top Users by Activity",
      "type": "table",
      "gridPos": {
        "h": 8,
        "w": 6,
        "x": 18,
        "y": 8
      },
      "datasource": {
        "type": "loki",
        "uid": "loki"
      },
      "targets": [
        {
          "expr": "topk(10, sum by (username) (count_over_time({job=\"sftp-gateway\", username=~\"$username\", action=~\"SFTP_FILE_UPLOAD_COMPLETE|SFTP_FILE_DOWNLOAD_COMPLETE|SFTP_DIR\"}[$__range])))",
          "legendFormat": "",
          "refId": "A"
        }
      ]
    },
    {
      "id": 8,
      "title": "File Search Results",
      "type": "logs",
      "gridPos": {
        "h": 8,
        "w": 24,
        "x": 0,
        "y": 16
      },
      "datasource": {
        "type": "loki",
        "uid": "loki"
      },
      "targets": [
        {
          "expr": "{job=\"sftp-gateway\", username=~\"$username\", action=~\"$action\"} |~ \"$search_file\"",
          "refId": "A"
        }
      ],
      "options": {
        "showTime": true,
        "showLabels": true,
        "showCommonLabels": false,
        "wrapLogMessage": true,
        "prettifyLogMessage": false,
        "enableLogDetails": true,
        "dedupStrategy": "none",
        "sortOrder": "Descending"
      }
    },
    {
      "id": 9,
      "title": "Failed Auth Over Time",
      "type": "timeseries",
      "gridPos": {
        "h": 6,
        "w": 12,
        "x": 0,
        "y": 24
      },
      "datasource": {
        "type": "loki",
        "uid": "loki"
      },
      "targets": [
        {
          "expr": "sum by (username) (count_over_time({job=\"sftp-gateway\", action=\"AUTHENTICATION_STARTED\"}[5m])) - sum by (username) (count_over_time({job=\"sftp-gateway\", action=\"AUTHENTICATION_COMPLETE\"}[5m]))",
          "legendFormat": "{{username}}",
          "refId": "A"
        }
      ],
      "fieldConfig": {
        "defaults": {
          "color": {
            "mode": "palette-classic"
          }
        }
      }
    },
    {
      "id": 10,
      "title": "Upload/Download Activity",
      "type": "timeseries",
      "gridPos": {
        "h": 6,
        "w": 12,
        "x": 12,
        "y": 24
      },
      "datasource": {
        "type": "loki",
        "uid": "loki"
      },
      "targets": [
        {
          "expr": "sum(count_over_time({job=\"sftp-gateway\", action=\"SFTP_FILE_DOWNLOAD_COMPLETE\", username=~\"$username\"}[1m]))",
          "legendFormat": "Downloads",
          "refId": "A"
        },
        {
          "expr": "sum(count_over_time({job=\"sftp-gateway\", action=\"SFTP_FILE_UPLOAD_COMPLETE\", username=~\"$username\"}[1m]))",
          "legendFormat": "Uploads",
          "refId": "B"
        }
      ]
    },
    {
      "id": 11,
      "title": "Session Activity",
      "type": "timeseries",
      "gridPos": {
        "h": 6,
        "w": 12,
        "x": 0,
        "y": 30
      },
      "datasource": {
        "type": "loki",
        "uid": "loki"
      },
      "targets": [
        {
          "expr": "sum(count_over_time({job=\"sftp-gateway\", action=\"SFTP_SESSION_STARTED\"}[5m]))",
          "legendFormat": "Sessions Started",
          "refId": "A"
        },
        {
          "expr": "sum(count_over_time({job=\"sftp-gateway\", action=\"SFTP_SESSION_STOPPED\"}[5m]))",
          "legendFormat": "Sessions Stopped",
          "refId": "B"
        }
      ]
    },
    {
      "id": 12,
      "title": "Connections by IP",
      "type": "table",
      "gridPos": {
        "h": 6,
        "w": 12,
        "x": 12,
        "y": 30
      },
      "datasource": {
        "type": "loki",
        "uid": "loki"
      },
      "targets": [
        {
          "expr": "topk(10, sum by (remote_ip) (count_over_time({job=\"sftp-gateway\", action=\"CONNECTED\"}[$__range])))",
          "legendFormat": "",
          "refId": "A"
        }
      ]
    }
  ]
}
Apple Silicon Users (M1/M2/M3): Add the following to your docker-compose.yml for Rosetta emulation compatibility:
- Add
platform: linux/amd64to both thebackendanduiservices- Add
JAVA_TOOL_OPTIONS=-XX:+UseSerialGC -Xmx2gto the backend environment variables (the default G1 garbage collector can crash under Rosetta emulation)
Step 3: Generate Security Credentials
Before starting the stack, generate unique security credentials. These environment variables will be used by Docker Compose:
export SECURITY_CLIENT_ID=$(openssl rand -hex 16)
export SECURITY_CLIENT_SECRET=$(openssl rand -hex 32)
export SECURITY_JWT_SECRET=$(uuidgen || cat /proc/sys/kernel/random/uuid)
Note: Run these commands in the same terminal session where you'll run
docker compose. The credentials are stored in environment variables and will be passed to the containers.
Step 4: Start the Stack
Launch all services with Docker Compose:
docker compose up -d
Monitor the startup progress:
docker compose logs -f
Wait for all services to become healthy. The backend service may take 60-90 seconds to fully start. You can check the status with:
docker compose ps
All services should show "healthy" or "running" status.
Step 5: Initial SFTP Gateway Setup
- Navigate to https://localhost in your web browser
- Accept the self-signed certificate warning
- Create your initial Web Admin account and sign in
- The default storage is configured as Local File System - files are stored in a Docker volume
- Navigate to the Users tab and create your first SFTP user
- Test the connection using an SFTP client like FileZilla:
- Host:
localhost - Port:
22 - Protocol: SFTP
- Username/Password: The SFTP user credentials you created
- Host:
Accessing Grafana
With SFTP Gateway running and processing file transfers, it's time to see your logs in action. Grafana provides the visual interface for exploring your data, and it comes pre-configured with a connection to Loki and a purpose-built dashboard for SFTP monitoring. The first time you log in, you'll want to change the default password and familiarize yourself with the dashboard layout.
Access Grafana directly:
- Navigate to http://localhost:3000 in your browser
- Log in with the default credentials:
admin/admin - Change the password when prompted
- Navigate to Dashboards → SFTP Gateway → SFTP Gateway Overview
Note: Logs will start appearing in Grafana once you perform some SFTP activity (connect, upload, download files).
Understanding the Dashboard
The pre-built SFTP Gateway Overview dashboard is designed to answer the most common questions about your file transfer activity at a glance. Rather than scrolling through raw log files, you can immediately see who's transferring files, how much data is moving, and whether anyone is trying to break in. The dashboard refreshes automatically every 10 seconds, giving you a near real-time view of activity.
Each panel serves a specific purpose, from high-level metrics to detailed log searches:
| Panel | What It Shows | Use Case |
|---|---|---|
| Log Volume | Total audit events over time | Identify busy periods, detect unusual activity spikes |
| Actions Breakdown | Pie chart of action types | Understand the mix of operations (uploads vs downloads vs directory listings) |
| Auth Success vs Failure | Count of successful and failed authentications | Security monitoring - watch for authentication attacks |
| Incomplete Auth (Failed Logins) | Failed login attempt count | Alert threshold indicator for brute force detection |
| Data Transferred by User | Bytes uploaded/downloaded per user | Identify heavy users, track data movement |
| IPs with Failed Auth | Top IPs with authentication failures | Identify potential attackers or misconfigured clients |
| Top Users by Activity | Most active users by operation count | Understand usage patterns |
| File Search Results | Searchable log entries | Find specific file transfers by filename |
| Failed Auth Over Time | Failed authentication trends | Spot attack patterns over time |
| Upload/Download Activity | File transfer trends over time | Monitor transfer volume patterns |
| Session Activity | Session starts/stops over time | Track concurrent usage |
| Connections by IP | Top connecting IP addresses | Identify primary client locations |
Using the Dashboard Filters
The dashboard includes three filters at the top:
- username - Filter all panels to show only specific users
- action - Filter to specific action types
- File Search - Text search across log content (use in the File Search Results panel)
Writing Custom Queries
The pre-built dashboard covers common use cases, but the real power of this observability stack is the ability to ask any question about your data. Grafana's Explore view lets you write custom queries using LogQL, Loki's query language. If you've used PromQL for metrics, LogQL will feel familiar—it uses similar syntax but is optimized for log data.
LogQL queries start with a log stream selector (like {job="sftp-gateway"}) and can be extended with filters, parsers, and aggregations. The examples below cover common scenarios, but you can combine these patterns to answer virtually any question about your file transfer activity.
Common Query Examples
Search for a specific file by name:
{job="sftp-gateway"} |= "invoice.pdf"
Find all uploads by a specific user:
{job="sftp-gateway", action="SFTP_FILE_UPLOAD_COMPLETE", username="johndoe"}
Count failed login attempts in the last hour:
sum(count_over_time({job="sftp-gateway", action="AUTHENTICATION_STARTED"}[1h]))
- sum(count_over_time({job="sftp-gateway", action="AUTHENTICATION_COMPLETE"}[1h]))
Calculate total data transferred by user in the last 24 hours:
sum by (username) (sum_over_time({job="sftp-gateway", action=~"SFTP_FILE_UPLOAD_COMPLETE|SFTP_FILE_DOWNLOAD_COMPLETE"} | unwrap bytes_transferred [24h]))
View all activity from a specific IP address:
{job="sftp-gateway", remote_ip="192.168.1.100"}
Find large file transfers (over 100MB):
{job="sftp-gateway", action=~"SFTP_FILE_UPLOAD_COMPLETE|SFTP_FILE_DOWNLOAD_COMPLETE"} | bytes_transferred > 104857600
Understanding SFTP Gateway Log Actions
To write effective queries and understand what's happening in your dashboards, it helps to know the vocabulary of SFTP Gateway's audit logs. Every significant event—from the moment a client connects to the final byte of a file transfer—generates a log entry with a specific action type. These actions tell the story of each connection's lifecycle.
The table below lists all action types you'll encounter. Notice how actions come in pairs (like AUTHENTICATION_STARTED and AUTHENTICATION_COMPLETE) which allows you to detect failures by finding started events without corresponding completions:
| Action | When It's Logged | Key Fields |
|---|---|---|
CONNECTION_ATTEMPT | Client initiates TCP connection | remote_ip |
CONNECTED | TCP connection established | remote_ip |
DISCONNECTED | Connection closed | remote_ip, username |
AUTHENTICATION_STARTED | Client begins authentication | remote_ip, username |
AUTHENTICATION_COMPLETE | Authentication succeeded | remote_ip, username, auth_method |
USERAUTH_STARTED | Specific auth method attempted | remote_ip, username, auth_method |
USERAUTH_SUCCESS | Specific auth method succeeded | remote_ip, username, auth_method |
SFTP_SESSION_STARTED | SFTP subsystem opened | remote_ip, username |
SFTP_SESSION_STOPPED | SFTP subsystem closed | remote_ip, username |
SFTP_DIR | Directory listing requested | remote_ip, username, file_path |
SFTP_FILE_UPLOAD_STARTED | Upload begins | remote_ip, username, file_path |
SFTP_FILE_UPLOAD_COMPLETE | Upload finishes | remote_ip, username, file_path, bytes_transferred |
SFTP_FILE_DOWNLOAD_STARTED | Download begins | remote_ip, username, file_path |
SFTP_FILE_DOWNLOAD_COMPLETE | Download finishes | remote_ip, username, file_path, bytes_transferred |
SFTP_SET_ATTRIBUTES | File attributes modified | remote_ip, username, file_path |
Detecting Failed Logins
SFTP Gateway does not log a specific "authentication failed" action. Instead, failed logins are detected by finding AUTHENTICATION_STARTED events that don't have a corresponding AUTHENTICATION_COMPLETE event.
The dashboard calculates this automatically:
(count of AUTHENTICATION_STARTED) - (count of AUTHENTICATION_COMPLETE) = failed attempts
This approach catches all failure modes: wrong password, invalid username, key rejection, and client disconnection during authentication.
Troubleshooting
When things don't work as expected, the key is to systematically check each component in the pipeline: Are containers running? Are logs being written? Is Alloy reading them? Is Loki receiving them? The commands below help you diagnose issues at each stage.
Services Not Starting
Check the status of all containers:
docker compose ps
View logs for a specific service:
docker compose logs backend
docker compose logs loki
docker compose logs alloy
Verifying Log Collection
Check if Alloy is successfully sending logs to Loki:
curl -s "http://localhost:3100/loki/api/v1/label/job/values"
Expected output:
{"status":"success","data":["sftp-gateway"]}
If "sftp-gateway" doesn't appear, check that:
- The backend service is healthy and generating logs
- Alloy can read the shared volume
Check Alloy logs:
docker compose logs alloy
Checking Loki Health
Verify Loki is ready to accept queries:
curl -s "http://localhost:3100/ready"
Expected output: ready
Inspecting the Log Volume
Check if logs are being written to the shared volume:
docker compose exec backend ls -la /opt/sftpgw/log/
Or from Alloy's perspective:
docker compose exec alloy ls -la /var/log/sftp-gateway/
Viewing Container Logs
Check individual container logs for errors:
docker compose logs loki
docker compose logs alloy
docker compose logs grafana
docker compose logs backend
Restarting the Stack
If you make configuration changes or need to restart:
docker compose restart
To completely stop and start (useful for major config changes):
docker compose down
docker compose up -d
Resetting Everything
To start fresh (warning: this deletes all data including SFTP users and logs):
docker compose down -v
docker compose up -d
Configuring S3 Storage (Optional)
While local file storage works well for testing and development, production deployments often need cloud storage for durability, scalability, and integration with existing workflows. SFTP Gateway supports AWS S3 as a storage backend, allowing users to upload files via SFTP that land directly in your S3 buckets.
By default, the deployment uses local file system storage within a Docker volume. To use AWS S3 instead:
- Edit the
docker-compose.ymlfile and modify the backend environment variables:
environment:
  # Change from local file system to S3
  - FEATURES_FIRST_CONNECTION_CLOUD_PROVIDER=aws
  - FEATURES_FIRST_CONNECTION_NAME=S3 Bucket Cloud Connection
  - FEATURES_FIRST_CONNECTION_REGION=us-east-1
  - FEATURES_FIRST_CONNECTION_BASE_PREFIX=your-s3-bucket-name
- Restart the backend service:
docker compose restart backend
- Configure AWS credentials through the SFTP Gateway Web UI after startup.
Security Considerations
This deployment prioritizes ease of setup over security hardening, making it ideal for local development, demos, and proof-of-concept work. The default configuration uses well-known passwords, self-signed certificates, and exposes services on all network interfaces. Before deploying in any environment where security matters, review and address the following areas:
This deployment is intended for local development and demo purposes. For production use, consider:
Change default credentials - Update the JWT secret, client ID/secret, and database password in docker-compose.yml
Use proper TLS certificates - Replace the self-signed certificates with valid certificates
Restrict port exposure - The current configuration exposes Grafana on all interfaces. Consider binding to localhost only
Network isolation - In production, separate the observability stack network from the SFTP Gateway network
Authentication integration - Configure Grafana LDAP, OAuth, or SAML for enterprise authentication
Resource limits - Adjust memory limits based on expected load
Maintenance
Once your stack is running, it requires minimal ongoing maintenance. Loki automatically manages log retention, Grafana persists your dashboards, and Docker handles container restarts. The tasks below cover the most common maintenance scenarios you might encounter.
Storage Management
View current log storage usage:
docker compose exec loki du -sh /loki
Logs are retained for 31 days by default. To change this, edit retention_period in loki/loki-config.yaml and restart Loki.
Backing Up Dashboards
Your custom dashboards are stored in Grafana's database. To back up:
docker cp grafana:/var/lib/grafana/grafana.db ./grafana-backup.db
The provisioned dashboard (sftp-overview.json) is already in your config directory.
Updating the Stack
To update to newer versions of any component:
- Edit
docker-compose.ymland update the image tags - Pull the new images and restart:
docker compose pull
docker compose up -d
Log Rotation
Loki handles its own data lifecycle based on the retention_period setting. The SFTP Gateway backend manages its own log rotation within the container.